Erin Yurday
Author
Author
15 January 2026
9 min read
Contents
Historical Rent Prices in EnglandAverage Rental Prices in the UKHow Much is a Rental Deposit?How Much are a Letting Agency Fees?FAQsMethodologyThe guidance on this site is based on our own analysis and is meant to help you identify options and narrow down your choices. We do not advise or tell you which product to buy; undertake your own due diligence before entering into any agreement.
With average private rents in England reaching £1,146 a month per household in early 2026, it's no surprise that housing costs are one of your biggest budget items. We took a deep dive into rental costs statistics from Gov.uk to learn more about rents depending on where you live, your age, and your type of household (e.g., single person, couple, family, etc.). We also looked at average rent deposits and fees. Here's what we found.
Over the past 15 years, private rents in England have increased 56% from £133 per week to £215 per week.
This increase was largely driven by rent rises in London, where private rents increased 70% over the same 15-year period, from £228 to £386 per week.
According to a January 2026 NimbleFins analysis of 2024-25 English Housing Survey data, the average rental cost in England is now estimated to be £1,146 a month per household for private renters and £572 for social renters (that is, local authority and housing association accommodation).
This number (i.e., the "average") is skewed on the high side by those paying very high rents, for instance in London. For that reason it's also useful to look at the median. The median is the midpoint so half of renters pay more than the midpoint and half pay less - therefore this figure can better reflect "typical" rental costs and is typically lower than the average. The median monthly rent in the UK is £952 for private renters and £513 for social renters.
How Much is Rent in the England? | Type | Social Renters | Private Renters |
Weekly | Median (Half of people spend more, half less) | £118 | £220 |
Weekly | Average | £132 | £265 |
Monthly | Median (Half of people spend more, half less) | £513 | £952 |
Monthly | Average | £572 | £1,146 |
Note, these figures reflect data from the 2024-25 English Housing Survey Headline Report, adjusted by subsequent inflation in January 2026 to reflect current pricing for early 2026: an additional 2.4% for social renters and 5.8% for private renters.
Renters who take out contents insurance should budget another £10 or so a month to protect their possessions from perils like fire, flood and theft - buying your own contents insurance is critical because your landlord's insurance won't usually cover your personal belongings.
Private renters in London pay 2X as much as private renters in the rest of England. NimbleFins adjusted English Housing Survey data by recent inflation to estimate that the average London private rent is £1,726 per month in early 2026; social renters pay £749 per month, on average in the capital.
How Much is Rent in London? | Type | Social Renters | Private Renters |
Weekly | Median (Half of people spend more, half less) | £159 | £386 |
Weekly | Average | £173 | £398 |
Monthly | Median (Half of people spend more, half less) | £689 | £1,671 |
Monthly | Average | £749 | £1,726 |
These figures reflect data from the 2024-25 English Housing Survey Headline Report, adjusted by subsequent inflation in January 2026 to reflect current pricing for early 2026: an additional 1.3% for London renters.
Excluding London, private renters in England pay £879 per month; social renters pay £501 per month, on average across the country.
How Much is Rent in the England (excluding London)? | Type | Social Renters | Private Renters |
Weekly | Median (Half of people spend more, half less) | £115 | £191 |
Weekly | Average | £123 | £215 |
Monthly | Median (Half of people spend more, half less) | £497 | £828 |
Monthly | Average | £533 | £931 |
People with no dependent children who rent privately pay an average of £1,185 per month for rent, while those with at least one dependent child pay an average of £1,243 per month (which implies that a typical family spends an extra £58 per month to house their children).
Fully employed people generally pay more than the unemployed, as you can see in the table below. But of those living in social housing, some unemployed people are paying more than fully-employed people.
Average Monthly Rent for Single People, Couples and Families | average | median | average | median |
no dependent children | £559 | £521 | £1,185 | £961 |
at least one dependent child | £627 | £572 | £1,243 | £1,105 |
receives housing support | £570 | £521 | £1,000 | £871 |
does not receive housing support | £595 | £548 | £1,273 | £1,081 |
full-time work | £616 | £578 | £1,277 | £1,081 |
unemployed | £547 | £505 | £1,014 | £841 |
The age group paying the most for rent per household is 16 to 24 year olds, who pay an average of £1,340 a month for privately-rented housing in England. At first glance, the rental cost figure for this age group seems too high, but there is a good reason why this type of household pays the highest price for rent in England.
For the 16 to 24 year old age group, multiple single adults often share a house or flat - and with many people come many beds, many bedrooms and higher rental rates. In addition, it's important to note that this age group finds renting the least affordable - that is, 16 to 24 year olds spend the highest proportion of their income on rent.
It's a different story among social renters, where 25 to 34 year olds pay the most - £640 a month on average.
Average UK Rent by Age, per household | All Social Renters | All Social Renters | Private Renters | Private Renters |
age of HRP | average | median | average | median |
16-24 | £602 | £519 | £1,340 | £1,099 |
25-34 | £640 | £554 | £1,253 | £1,074 |
35-44 | £628 | £559 | £1,230 | £1,103 |
45-54 | £572 | £541 | £1,161 | £958 |
55-64 | £520 | £500 | £904 | £851 |
65 or over | £535 | £506 | £850 | £721 |
Renters in the North East pay the least for housing, whether they live in social or private accommodation. In fact, private renters in the North East pay 42% less than the average private rent in England; social renters pay 19% less than average. The average monthly rent in the North East is £703 for private renters.
Not surprisingly, renters pay the most in London where the average monthly rent is £1,896. In the capital, private rental prices are ~2X higher than the average in the rest of England and social rental prices are ~40% higher than average.
Average Rent by Region of England | average | median | average | median |
North East | £474 | £460 | £703 | £638 |
North West | £504 | £503 | £847 | £790 |
Yorkshire and The Humber | £477 | £441 | £853 | £741 |
East Midlands | £528 | £488 | £888 | £841 |
West Midlands | £517 | £494 | £862 | £819 |
South West | £569 | £530 | £1,038 | £936 |
East of England | £578 | £550 | £1,097 | £1,037 |
South East | £654 | £592 | £1,276 | £1,183 |
London | £747 | £686 | £1,896 | £1,750 |
Note, the previous three sections, and the data below, reflect 2022/23 data, ramped up for inflation in January 2026 to estimate current rental rates in 2026. As a result, these figures are estimates - and you'll notice that the figures for London are a bit different than the figures for London at the top of this article (those were based on 2023/24 figures, ramped up for inflation through January 2026).
While the average rent per week in England is £132 pw for social renters and £265 pw for private renters, rent prices vary be a number of factors. Here is a recap of average weekly rents across different types of households (e.g., no kids, kids, employment, etc.), ages and regions.
Average Weekly Rent UK, per household | All Social Renters | Private Renters |
no dependent children | £129 | £273 |
at least one dependent child | £145 | £287 |
receives housing support | £132 | £231 |
does not receive housing support | £137 | £294 |
full-time work | £142 | £295 |
unemployed | £126 | £234 |
by age | ||
16-24 years old | £139 | £309 |
25-34 years old | £148 | £289 |
35-44 years old | £145 | £284 |
45-54 years old | £132 | £268 |
55-64 years old | £120 | £209 |
65 or over | £123 | £196 |
by region | ||
North East | £109 | £162 |
North West | £116 | £195 |
Yorkshire and The Humber | £110 | £197 |
East Midlands | £122 | £205 |
West Midlands | £119 | £199 |
South West | £131 | £240 |
East of England | £133 | £253 |
South East | £151 | £294 |
London | £172 | £437 |
Average | £134 | £279 |
While the average rent per month in England is £572 pcm for social renters and £1,146 pcm for private renters, rent prices vary be a number of factors. Here is a recap of average monthly rents across different types of households (e.g., family with and without kids, employment, etc.), ages and regions.
Average Monthly Rent UK, per household | Social Renters | Private Renters |
no dependent children | £559 | £1,185 |
at least one dependent child | £627 | £1,243 |
receives housing support | £570 | £1,000 |
does not receive housing support | £595 | £1,273 |
full-time work | £616 | £1,277 |
unemployed | £547 | £1,014 |
by age | ||
16-24 years old | £602 | £1,340 |
25-34 years old | £640 | £1,253 |
35-44 years old | £628 | £1,230 |
45-54 years old | £572 | £1,161 |
55-64 years old | £520 | £904 |
65 or over | £535 | £850 |
by region | ||
North East | £474 | £703 |
North West | £504 | £847 |
Yorkshire and The Humber | £477 | £853 |
East Midlands | £528 | £888 |
West Midlands | £517 | £862 |
South West | £569 | £1,038 |
East of England | £578 | £1,097 |
South East | £654 | £1,276 |
London | £747 | £1,896 |
Average | £572 | £1,146 |
The average rental deposit in the UK is at least four weeks of rent. In fact, nearly half (48.8%) of households pay four weeks or one calendar month of rent. Another 39.4% of renters are asked to pay a deposit of more than four weeks of rent. Just 11.8% of households who rent pay three weeks or less as a deposit.
Average Rental Deposit UK | Average Rental Deposit UK |
Less than one weeks rent | 2.7% |
One weeks rent (up to two weeks rent) | 2.7% |
Two weeks rent (up to three weeks rent) | 3.0% |
Three weeks rent (up to four weeks rent) | 3.3% |
Four weeks rent/one calendar months rent | 48.8% |
More than four weeks rent | 39.4% |
Total | 100.0% |
Note, these figures are from a previous release of the English Housing Survey.
In England, 81.3% of renters didn't pay a letting agency fee in 2022/23 - but the other 18.7% did pay fees.
How much are rent fees, and where do they go? Let's take a look.
In a previous release of the English Housing Survey (more recent data is unfortunately not available - but we think this is still useful to share), it was most common for renters in England to pay between £200 and £300 in rental fees; and average rental fees are in the region of £300. However, there's a wide range in rental fees in the UK - 13.4% of renters pay under £100 in fees while 12.2% pay £500 or more.
Percentage of Renters Paying This Much in Fees | Percentage of Renters Paying This Much in Fees |
less than £100 | 13.4% |
£100 to less than £200 | 25.8% |
£200 to less than £300 | 23.7% |
£300 to less than £400 | 18.4% |
£400 to less than £500 | 6.6% |
£500 or more | 12.2% |
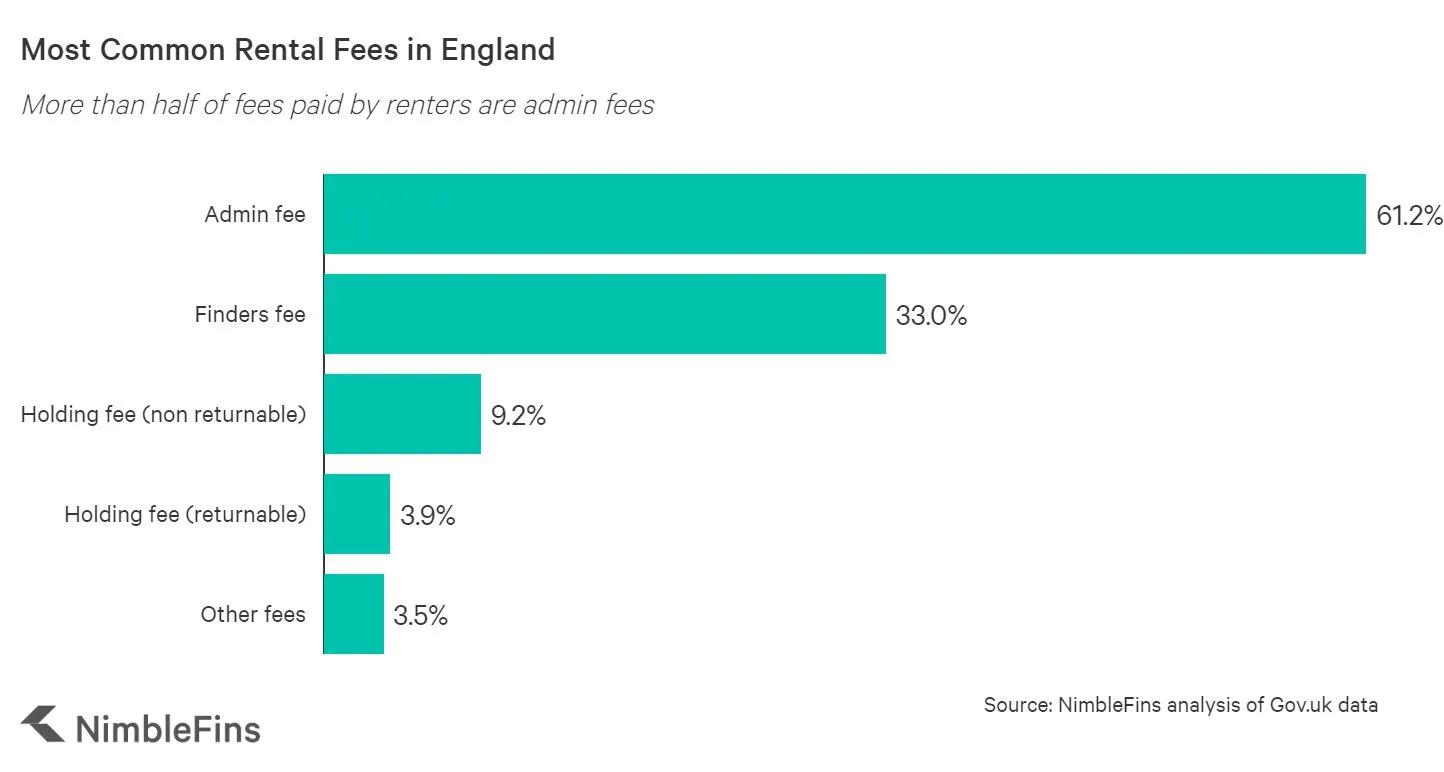
Most common were admin fees, followed by finders fees and holding fees. The majority of holding fees are non returnable.
Percentage of Renters Paying Fees | Percentage of Renters Paying Fees |
Admin fee (non returnable) | 61.2% |
Finders fee (non returnable) | 33.0% |
Holding fee (non returnable) | 9.2% |
Holding fee (returnable) | 3.9% |
Other fees | 3.5% |
Note, these figures are from a previous release of the English Housing Survey.
The average council house rent (i.e., local authority) is £126 a week or £545 a month per household in England.
NimbleFins estimates, using current inflation data in January 2026, that average private rent in England is £265 a week or £1,146 a month. Social renters pay an average of £132 a week or £572 a month.
The average London household pays £1,726 a month in private rent (£398 a week). While rents in some areas are exceptionally high, half of London households pay under £1,671 a month (£386 a week). These figures reflect private renters. Social rents in London are around 57% lower on average.
Rent fees range from £0 to over £500, with most renters paying just under £300 in fees (most of which are "admin").
In England, nearly all renters pay 4 weeks of rent/one calendar month or more. See more rent deposit figures here.
In the past ten years, private rents in England have increased 43%, or roughly 4.3% per year on average. Landlords can only increase rent as laid out in your tenancy agreement.
To arrive at the figures in this study we anaylsed data from the English Housing Survey 2024-25 from Gov.uk, and increased those figures by rental inflation figures available in January 2026 to bring the figures to a current estimate. The sections on age, household type and region reflect the previous year's English Housing Survey, from 2022/23 (again, ramped up by inflation since then in January 2026), because more recent data is not available. Please note, the rent figures discussed in this study are per household not per person.
Author
15 January 2026
9 min read
Contents
Historical Rent Prices in EnglandAverage Rental Prices in the UKHow Much is a Rental Deposit?How Much are a Letting Agency Fees?FAQsMethodologyThe guidance on this site is based on our own analysis and is meant to help you identify options and narrow down your choices. We do not advise or tell you which product to buy; undertake your own due diligence before entering into any agreement.
Author
Erin was the founder of NimbleFins, a data driven personal finance site. A former derivatives trader and finance expert at the Stanford Graduate School. Erin turns research into plain answers so you can understand your credit.
Author
15 January 2026
9 min read
Contents
Historical Rent Prices in EnglandAverage Rental Prices in the UKHow Much is a Rental Deposit?How Much are a Letting Agency Fees?FAQsMethodologyThe guidance on this site is based on our own analysis and is meant to help you identify options and narrow down your choices. We do not advise or tell you which product to buy; undertake your own due diligence before entering into any agreement.
With average private rents in England reaching £1,146 a month per household in early 2026, it's no surprise that housing costs are one of your biggest budget items. We took a deep dive into rental costs statistics from Gov.uk to learn more about rents depending on where you live, your age, and your type of household (e.g., single person, couple, family, etc.). We also looked at average rent deposits and fees. Here's what we found.
Over the past 15 years, private rents in England have increased 56% from £133 per week to £215 per week.
This increase was largely driven by rent rises in London, where private rents increased 70% over the same 15-year period, from £228 to £386 per week.
According to a January 2026 NimbleFins analysis of 2024-25 English Housing Survey data, the average rental cost in England is now estimated to be £1,146 a month per household for private renters and £572 for social renters (that is, local authority and housing association accommodation).
This number (i.e., the "average") is skewed on the high side by those paying very high rents, for instance in London. For that reason it's also useful to look at the median. The median is the midpoint so half of renters pay more than the midpoint and half pay less - therefore this figure can better reflect "typical" rental costs and is typically lower than the average. The median monthly rent in the UK is £952 for private renters and £513 for social renters.
How Much is Rent in the England? | Type | Social Renters | Private Renters |
Weekly | Median (Half of people spend more, half less) | £118 | £220 |
Weekly | Average | £132 | £265 |
Monthly | Median (Half of people spend more, half less) | £513 | £952 |
Monthly | Average | £572 | £1,146 |
Note, these figures reflect data from the 2024-25 English Housing Survey Headline Report, adjusted by subsequent inflation in January 2026 to reflect current pricing for early 2026: an additional 2.4% for social renters and 5.8% for private renters.
Renters who take out contents insurance should budget another £10 or so a month to protect their possessions from perils like fire, flood and theft - buying your own contents insurance is critical because your landlord's insurance won't usually cover your personal belongings.
Private renters in London pay 2X as much as private renters in the rest of England. NimbleFins adjusted English Housing Survey data by recent inflation to estimate that the average London private rent is £1,726 per month in early 2026; social renters pay £749 per month, on average in the capital.
How Much is Rent in London? | Type | Social Renters | Private Renters |
Weekly | Median (Half of people spend more, half less) | £159 | £386 |
Weekly | Average | £173 | £398 |
Monthly | Median (Half of people spend more, half less) | £689 | £1,671 |
Monthly | Average | £749 | £1,726 |
These figures reflect data from the 2024-25 English Housing Survey Headline Report, adjusted by subsequent inflation in January 2026 to reflect current pricing for early 2026: an additional 1.3% for London renters.
Excluding London, private renters in England pay £879 per month; social renters pay £501 per month, on average across the country.
How Much is Rent in the England (excluding London)? | Type | Social Renters | Private Renters |
Weekly | Median (Half of people spend more, half less) | £115 | £191 |
Weekly | Average | £123 | £215 |
Monthly | Median (Half of people spend more, half less) | £497 | £828 |
Monthly | Average | £533 | £931 |
People with no dependent children who rent privately pay an average of £1,185 per month for rent, while those with at least one dependent child pay an average of £1,243 per month (which implies that a typical family spends an extra £58 per month to house their children).
Fully employed people generally pay more than the unemployed, as you can see in the table below. But of those living in social housing, some unemployed people are paying more than fully-employed people.
Average Monthly Rent for Single People, Couples and Families | average | median | average | median |
no dependent children | £559 | £521 | £1,185 | £961 |
at least one dependent child | £627 | £572 | £1,243 | £1,105 |
receives housing support | £570 | £521 | £1,000 | £871 |
does not receive housing support | £595 | £548 | £1,273 | £1,081 |
full-time work | £616 | £578 | £1,277 | £1,081 |
unemployed | £547 | £505 | £1,014 | £841 |
The age group paying the most for rent per household is 16 to 24 year olds, who pay an average of £1,340 a month for privately-rented housing in England. At first glance, the rental cost figure for this age group seems too high, but there is a good reason why this type of household pays the highest price for rent in England.
For the 16 to 24 year old age group, multiple single adults often share a house or flat - and with many people come many beds, many bedrooms and higher rental rates. In addition, it's important to note that this age group finds renting the least affordable - that is, 16 to 24 year olds spend the highest proportion of their income on rent.
It's a different story among social renters, where 25 to 34 year olds pay the most - £640 a month on average.
Average UK Rent by Age, per household | All Social Renters | All Social Renters | Private Renters | Private Renters |
age of HRP | average | median | average | median |
16-24 | £602 | £519 | £1,340 | £1,099 |
25-34 | £640 | £554 | £1,253 | £1,074 |
35-44 | £628 | £559 | £1,230 | £1,103 |
45-54 | £572 | £541 | £1,161 | £958 |
55-64 | £520 | £500 | £904 | £851 |
65 or over | £535 | £506 | £850 | £721 |
Renters in the North East pay the least for housing, whether they live in social or private accommodation. In fact, private renters in the North East pay 42% less than the average private rent in England; social renters pay 19% less than average. The average monthly rent in the North East is £703 for private renters.
Not surprisingly, renters pay the most in London where the average monthly rent is £1,896. In the capital, private rental prices are ~2X higher than the average in the rest of England and social rental prices are ~40% higher than average.
Average Rent by Region of England | average | median | average | median |
North East | £474 | £460 | £703 | £638 |
North West | £504 | £503 | £847 | £790 |
Yorkshire and The Humber | £477 | £441 | £853 | £741 |
East Midlands | £528 | £488 | £888 | £841 |
West Midlands | £517 | £494 | £862 | £819 |
South West | £569 | £530 | £1,038 | £936 |
East of England | £578 | £550 | £1,097 | £1,037 |
South East | £654 | £592 | £1,276 | £1,183 |
London | £747 | £686 | £1,896 | £1,750 |
Note, the previous three sections, and the data below, reflect 2022/23 data, ramped up for inflation in January 2026 to estimate current rental rates in 2026. As a result, these figures are estimates - and you'll notice that the figures for London are a bit different than the figures for London at the top of this article (those were based on 2023/24 figures, ramped up for inflation through January 2026).
While the average rent per week in England is £132 pw for social renters and £265 pw for private renters, rent prices vary be a number of factors. Here is a recap of average weekly rents across different types of households (e.g., no kids, kids, employment, etc.), ages and regions.
Average Weekly Rent UK, per household | All Social Renters | Private Renters |
no dependent children | £129 | £273 |
at least one dependent child | £145 | £287 |
receives housing support | £132 | £231 |
does not receive housing support | £137 | £294 |
full-time work | £142 | £295 |
unemployed | £126 | £234 |
by age | ||
16-24 years old | £139 | £309 |
25-34 years old | £148 | £289 |
35-44 years old | £145 | £284 |
45-54 years old | £132 | £268 |
55-64 years old | £120 | £209 |
65 or over | £123 | £196 |
by region | ||
North East | £109 | £162 |
North West | £116 | £195 |
Yorkshire and The Humber | £110 | £197 |
East Midlands | £122 | £205 |
West Midlands | £119 | £199 |
South West | £131 | £240 |
East of England | £133 | £253 |
South East | £151 | £294 |
London | £172 | £437 |
Average | £134 | £279 |
While the average rent per month in England is £572 pcm for social renters and £1,146 pcm for private renters, rent prices vary be a number of factors. Here is a recap of average monthly rents across different types of households (e.g., family with and without kids, employment, etc.), ages and regions.
Average Monthly Rent UK, per household | Social Renters | Private Renters |
no dependent children | £559 | £1,185 |
at least one dependent child | £627 | £1,243 |
receives housing support | £570 | £1,000 |
does not receive housing support | £595 | £1,273 |
full-time work | £616 | £1,277 |
unemployed | £547 | £1,014 |
by age | ||
16-24 years old | £602 | £1,340 |
25-34 years old | £640 | £1,253 |
35-44 years old | £628 | £1,230 |
45-54 years old | £572 | £1,161 |
55-64 years old | £520 | £904 |
65 or over | £535 | £850 |
by region | ||
North East | £474 | £703 |
North West | £504 | £847 |
Yorkshire and The Humber | £477 | £853 |
East Midlands | £528 | £888 |
West Midlands | £517 | £862 |
South West | £569 | £1,038 |
East of England | £578 | £1,097 |
South East | £654 | £1,276 |
London | £747 | £1,896 |
Average | £572 | £1,146 |
The average rental deposit in the UK is at least four weeks of rent. In fact, nearly half (48.8%) of households pay four weeks or one calendar month of rent. Another 39.4% of renters are asked to pay a deposit of more than four weeks of rent. Just 11.8% of households who rent pay three weeks or less as a deposit.
Average Rental Deposit UK | Average Rental Deposit UK |
Less than one weeks rent | 2.7% |
One weeks rent (up to two weeks rent) | 2.7% |
Two weeks rent (up to three weeks rent) | 3.0% |
Three weeks rent (up to four weeks rent) | 3.3% |
Four weeks rent/one calendar months rent | 48.8% |
More than four weeks rent | 39.4% |
Total | 100.0% |
Note, these figures are from a previous release of the English Housing Survey.
In England, 81.3% of renters didn't pay a letting agency fee in 2022/23 - but the other 18.7% did pay fees.
How much are rent fees, and where do they go? Let's take a look.
In a previous release of the English Housing Survey (more recent data is unfortunately not available - but we think this is still useful to share), it was most common for renters in England to pay between £200 and £300 in rental fees; and average rental fees are in the region of £300. However, there's a wide range in rental fees in the UK - 13.4% of renters pay under £100 in fees while 12.2% pay £500 or more.
Percentage of Renters Paying This Much in Fees | Percentage of Renters Paying This Much in Fees |
less than £100 | 13.4% |
£100 to less than £200 | 25.8% |
£200 to less than £300 | 23.7% |
£300 to less than £400 | 18.4% |
£400 to less than £500 | 6.6% |
£500 or more | 12.2% |
Most common were admin fees, followed by finders fees and holding fees. The majority of holding fees are non returnable.
Percentage of Renters Paying Fees | Percentage of Renters Paying Fees |
Admin fee (non returnable) | 61.2% |
Finders fee (non returnable) | 33.0% |
Holding fee (non returnable) | 9.2% |
Holding fee (returnable) | 3.9% |
Other fees | 3.5% |
Note, these figures are from a previous release of the English Housing Survey.
The average council house rent (i.e., local authority) is £126 a week or £545 a month per household in England.
NimbleFins estimates, using current inflation data in January 2026, that average private rent in England is £265 a week or £1,146 a month. Social renters pay an average of £132 a week or £572 a month.
The average London household pays £1,726 a month in private rent (£398 a week). While rents in some areas are exceptionally high, half of London households pay under £1,671 a month (£386 a week). These figures reflect private renters. Social rents in London are around 57% lower on average.
Rent fees range from £0 to over £500, with most renters paying just under £300 in fees (most of which are "admin").
In England, nearly all renters pay 4 weeks of rent/one calendar month or more. See more rent deposit figures here.
In the past ten years, private rents in England have increased 43%, or roughly 4.3% per year on average. Landlords can only increase rent as laid out in your tenancy agreement.
To arrive at the figures in this study we anaylsed data from the English Housing Survey 2024-25 from Gov.uk, and increased those figures by rental inflation figures available in January 2026 to bring the figures to a current estimate. The sections on age, household type and region reflect the previous year's English Housing Survey, from 2022/23 (again, ramped up by inflation since then in January 2026), because more recent data is not available. Please note, the rent figures discussed in this study are per household not per person.
Author
15 January 2026
9 min read
Contents
Historical Rent Prices in EnglandAverage Rental Prices in the UKHow Much is a Rental Deposit?How Much are a Letting Agency Fees?FAQsMethodologyThe guidance on this site is based on our own analysis and is meant to help you identify options and narrow down your choices. We do not advise or tell you which product to buy; undertake your own due diligence before entering into any agreement.
Author
Erin was the founder of NimbleFins, a data driven personal finance site. A former derivatives trader and finance expert at the Stanford Graduate School. Erin turns research into plain answers so you can understand your credit.