Erin Yurday
Author
Author
18 November 2025
5 min read
Contents
How much is my ISA worth?Cash ISA vs Stocks and Shares ISAHow many ISAs can I have?How much can I put in an ISA?The guidance on this site is based on our own analysis and is meant to help you identify options and narrow down your choices. We do not advise or tell you which product to buy; undertake your own due diligence before entering into any agreement.
Inflation is 3.8%, meaning any ISA paying below this rate has delivered a real-terms loss, even if the balance increased.
Using Bank of England data, last year’s £10,000 now needs £10,379.74 to buy the same goods; £20,000 now needs £20,759.49.
With inflation at 3.8%, any ISA paying below 3.8% has effectively delivered a real-terms loss, even if the balance has gone up on paper. That’s because your savings could buy more a year ago than they can today.
To show the impact, NimbleFins has compared how much £10,000 and £20,000 would have earned in common ISA rates — and how much that cash is worth after a year of inflation.
Disclaimer: Capital at risk. Investments can fall as well as rise, so you could get back less than you invest.
The Bank of England’s inflation calculator shows you’d need £10,379.74 today to buy products and services that cost just £10,000 last year.
And products costing £20,000 in 2024 is the equivalent of £20,759.49 today.
This means your ISA must earn at least £380 on £10,000 — or £760 on £20,000 — just to stand still and maintain its real value.
Below shows what happens if you put £10,000 or £20,000 in a cash ISA for one year at various interest rates, and how that compares to the impact of 3.8% inflation.
£10,000 saved for 1 year
Interest rate | Balance after 1 year | Cost today of last year's £10,000 | Real-terms gain/loss vs inflation |
1% | £10,100 | £10,380 | -£280 |
2% | £10,200 | £10,380 | -£180 |
3% | £10,300 | £10,380 | -£80 |
4% | £10,400 | £10,380 | £20 |
5% | £10,500 | £10,380 | £120 |
£20,000 saved for 1 year
Interest rate | Balance after 1 year | Cost today of last year's £20,000 | Real-terms gain/loss vs inflation |
1% | £20,200 | £20,760 | -£560 |
2% | £20,400 | £20,760 | -£360 |
3% | £20,600 | £20,760 | -£160 |
4% | £20,800 | £20,760 | £40 |
5% | £21,000 | £20,760 | £240 |
What the figures mean
After years of low interest rates, many savers remain in older, uncompetitive cash ISAs paying 1–2%, despite top easy-access rates reaching 4–5% earlier this year.
But unless your ISA matched or beat inflation, your money lost purchasing power.
This effect compounds over time - meaning even small gaps between your interest rate and inflation can gradually wipe out years of gains.
At 1%, £10,000 earns just £100 interest - but inflation erodes £380 of value.
Even at 3%, savers lose around £200 in real terms on a £10,000 pot.
Only ISAs paying above inflation (3.8%) protect savers from being worse off.
A saver with £20,000 at 1% is effectively £760 poorer after a year.
While ISA balances may have increased slightly, the spending power of the money has dropped. That’s the inflation penalty long-term savers are facing.
Cash ISAs offer certainty because your balance never falls, but the returns have struggled to keep pace with inflation. Stocks and shares ISAs carry investment risk, but historically have delivered much stronger long-term growth.
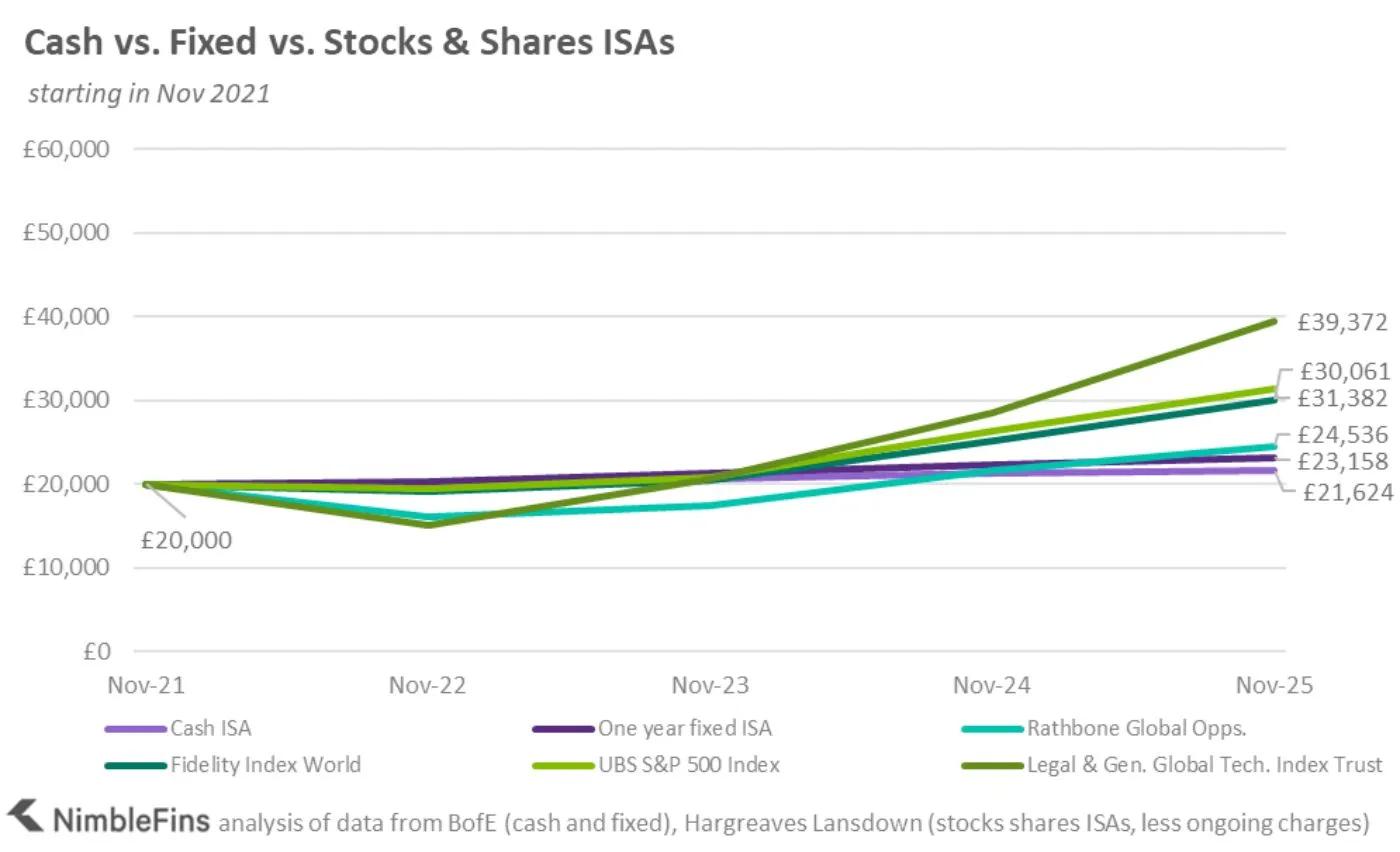
Our analysis compared what happened to a £20,000 ISA starting in November 2020 and again from November 2021, using Bank of England cash ISA data and performance data from several popular stock market funds.
The two charts start one year apart - which dramatically changes the results for stocks and shares ISAs. Investment ISA returns depend heavily on timing: the earlier start date captures the strong market recovery after COVID-19, while the later start date includes the 2022 downturn, when many funds posted losses in the first year.
Cash ISA returns barely change between the two charts because they are not affected by market movements.
The results show:
Cash ISAs grew slowly in both scenarios, rising only modestly over the period.
One-year fixed ISAs performed better than easy-access ISAs, but still lagged behind most investment ISAs.
Some stocks and shares ISAs delivered two to three times the value of cash ISAs over the same period.
The Legal & General Global Tech Index Trust and Fidelity Index World were among the strongest performers, reaching £54,459 and £41,384 respectively in the first chart.
However, not all investment ISAs performed strongly — for example, Rathbone Global Opportunities barely beat cash over one of the time periods, demonstrating how variable returns can be.
Cited fund outcomes are historic examples, and are not indicative of future returns, consumers may receive less than invested.
You can open as many ISAs as you like across your lifetime - including cash ISAs, stocks & shares ISAs, Innovative Finance ISAs and Lifetime ISAs.
However, you can only pay into one of each ISA type per tax year.
That means in one tax year you can pay into a maximum of:
One cash ISA
One stocks & shares ISA
One IFISA
One Lifetime ISA (if eligible)
As of April 2024, holding multiple ISAs is allowed, but paying into multiple of the same type in a single year is not.
The current ISA allowance is £20,000 per year. You can split this £20,000 across the different ISA types in any combination. For example:
£10,000 into a cash ISA
£8,000 into a stocks & shares ISA
£2,000 into an IFISA
Or all £20,000 into one ISA if you prefer.
Lifetime ISAs are the exception: you can only deposit £4,000 a year into a LISA, and it forms part of the overall £20,000 limit.
Summary
Inflation has eroded the buying power of ISA savings, with a 3.8% rise meaning last year’s £10,000 and £20,000 are now worth far less in real terms.
Savers whose ISAs paid under 3.8% have effectively lost money, despite earning interest.
The comparison tables show the real-terms gains and losses at 1-5% ISA rates, highlighting how older low-rate ISAs fall short.
ISA rules changed in April 2024, allowing savers to contribute to multiple ISAs of the same type in a single tax year, provided the total remains under £20,000.
Read more:
Author
18 November 2025
5 min read
Contents
How much is my ISA worth?Cash ISA vs Stocks and Shares ISAHow many ISAs can I have?How much can I put in an ISA?The guidance on this site is based on our own analysis and is meant to help you identify options and narrow down your choices. We do not advise or tell you which product to buy; undertake your own due diligence before entering into any agreement.
Author
Erin was the founder of NimbleFins, a data driven personal finance site. A former derivatives trader and finance expert at the Stanford Graduate School. Erin turns research into plain answers so you can understand your credit.
Author
18 November 2025
5 min read
Contents
How much is my ISA worth?Cash ISA vs Stocks and Shares ISAHow many ISAs can I have?How much can I put in an ISA?The guidance on this site is based on our own analysis and is meant to help you identify options and narrow down your choices. We do not advise or tell you which product to buy; undertake your own due diligence before entering into any agreement.
Inflation is 3.8%, meaning any ISA paying below this rate has delivered a real-terms loss, even if the balance increased.
Using Bank of England data, last year’s £10,000 now needs £10,379.74 to buy the same goods; £20,000 now needs £20,759.49.
With inflation at 3.8%, any ISA paying below 3.8% has effectively delivered a real-terms loss, even if the balance has gone up on paper. That’s because your savings could buy more a year ago than they can today.
To show the impact, NimbleFins has compared how much £10,000 and £20,000 would have earned in common ISA rates — and how much that cash is worth after a year of inflation.
Disclaimer: Capital at risk. Investments can fall as well as rise, so you could get back less than you invest.
The Bank of England’s inflation calculator shows you’d need £10,379.74 today to buy products and services that cost just £10,000 last year.
And products costing £20,000 in 2024 is the equivalent of £20,759.49 today.
This means your ISA must earn at least £380 on £10,000 — or £760 on £20,000 — just to stand still and maintain its real value.
Below shows what happens if you put £10,000 or £20,000 in a cash ISA for one year at various interest rates, and how that compares to the impact of 3.8% inflation.
£10,000 saved for 1 year
Interest rate | Balance after 1 year | Cost today of last year's £10,000 | Real-terms gain/loss vs inflation |
1% | £10,100 | £10,380 | -£280 |
2% | £10,200 | £10,380 | -£180 |
3% | £10,300 | £10,380 | -£80 |
4% | £10,400 | £10,380 | £20 |
5% | £10,500 | £10,380 | £120 |
£20,000 saved for 1 year
Interest rate | Balance after 1 year | Cost today of last year's £20,000 | Real-terms gain/loss vs inflation |
1% | £20,200 | £20,760 | -£560 |
2% | £20,400 | £20,760 | -£360 |
3% | £20,600 | £20,760 | -£160 |
4% | £20,800 | £20,760 | £40 |
5% | £21,000 | £20,760 | £240 |
What the figures mean
After years of low interest rates, many savers remain in older, uncompetitive cash ISAs paying 1–2%, despite top easy-access rates reaching 4–5% earlier this year.
But unless your ISA matched or beat inflation, your money lost purchasing power.
This effect compounds over time - meaning even small gaps between your interest rate and inflation can gradually wipe out years of gains.
At 1%, £10,000 earns just £100 interest - but inflation erodes £380 of value.
Even at 3%, savers lose around £200 in real terms on a £10,000 pot.
Only ISAs paying above inflation (3.8%) protect savers from being worse off.
A saver with £20,000 at 1% is effectively £760 poorer after a year.
While ISA balances may have increased slightly, the spending power of the money has dropped. That’s the inflation penalty long-term savers are facing.
Cash ISAs offer certainty because your balance never falls, but the returns have struggled to keep pace with inflation. Stocks and shares ISAs carry investment risk, but historically have delivered much stronger long-term growth.
Our analysis compared what happened to a £20,000 ISA starting in November 2020 and again from November 2021, using Bank of England cash ISA data and performance data from several popular stock market funds.
The two charts start one year apart - which dramatically changes the results for stocks and shares ISAs. Investment ISA returns depend heavily on timing: the earlier start date captures the strong market recovery after COVID-19, while the later start date includes the 2022 downturn, when many funds posted losses in the first year.
Cash ISA returns barely change between the two charts because they are not affected by market movements.
The results show:
Cash ISAs grew slowly in both scenarios, rising only modestly over the period.
One-year fixed ISAs performed better than easy-access ISAs, but still lagged behind most investment ISAs.
Some stocks and shares ISAs delivered two to three times the value of cash ISAs over the same period.
The Legal & General Global Tech Index Trust and Fidelity Index World were among the strongest performers, reaching £54,459 and £41,384 respectively in the first chart.
However, not all investment ISAs performed strongly — for example, Rathbone Global Opportunities barely beat cash over one of the time periods, demonstrating how variable returns can be.
Cited fund outcomes are historic examples, and are not indicative of future returns, consumers may receive less than invested.
You can open as many ISAs as you like across your lifetime - including cash ISAs, stocks & shares ISAs, Innovative Finance ISAs and Lifetime ISAs.
However, you can only pay into one of each ISA type per tax year.
That means in one tax year you can pay into a maximum of:
One cash ISA
One stocks & shares ISA
One IFISA
One Lifetime ISA (if eligible)
As of April 2024, holding multiple ISAs is allowed, but paying into multiple of the same type in a single year is not.
The current ISA allowance is £20,000 per year. You can split this £20,000 across the different ISA types in any combination. For example:
£10,000 into a cash ISA
£8,000 into a stocks & shares ISA
£2,000 into an IFISA
Or all £20,000 into one ISA if you prefer.
Lifetime ISAs are the exception: you can only deposit £4,000 a year into a LISA, and it forms part of the overall £20,000 limit.
Summary
Inflation has eroded the buying power of ISA savings, with a 3.8% rise meaning last year’s £10,000 and £20,000 are now worth far less in real terms.
Savers whose ISAs paid under 3.8% have effectively lost money, despite earning interest.
The comparison tables show the real-terms gains and losses at 1-5% ISA rates, highlighting how older low-rate ISAs fall short.
ISA rules changed in April 2024, allowing savers to contribute to multiple ISAs of the same type in a single tax year, provided the total remains under £20,000.
Read more:
Author
18 November 2025
5 min read
Contents
How much is my ISA worth?Cash ISA vs Stocks and Shares ISAHow many ISAs can I have?How much can I put in an ISA?The guidance on this site is based on our own analysis and is meant to help you identify options and narrow down your choices. We do not advise or tell you which product to buy; undertake your own due diligence before entering into any agreement.
Author
Erin was the founder of NimbleFins, a data driven personal finance site. A former derivatives trader and finance expert at the Stanford Graduate School. Erin turns research into plain answers so you can understand your credit.