Erin Yurday
Author
Author
13 February 2026
8 min read
Contents
Average Salary UKAverage Hourly Pay UKAverage Household Income UKWho Earns the Most?Average Pay by Gender UKRegional Pay DifferencesThe guidance on this site is based on our own analysis and is meant to help you identify options and narrow down your choices. We do not advise or tell you which product to buy; undertake your own due diligence before entering into any agreement.
For early 2026, the average full-time salary in the UK is £48,512, but there's much more detail to understand about pay beyond this headline figure. NimbleFins digs into official Office for National Statistics data to calculate average (mean) and median salaries for different regions, genders, types of work (full or part time) and more.
In addition to learning what jobs typically pay, our team also looks into disposable income figures for an entire household, to learn what people typically have at their disposal after taxes to spend and save.
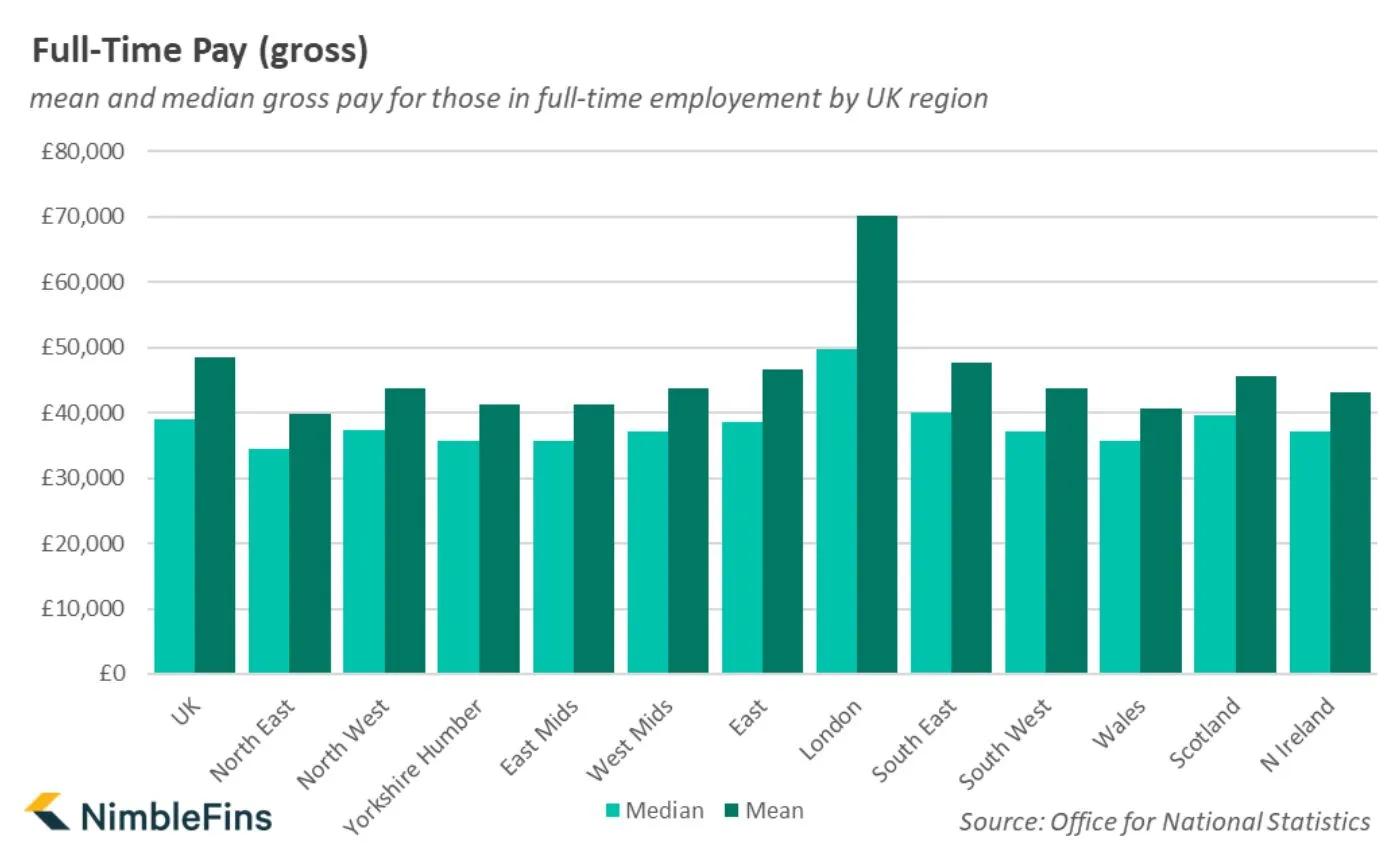
The average full-time salary in the UK is £45,836 per annum. The median full-time salary in the UK is quite a bit lower, at £39,039. The median can be a better representation of a 'typical' figure because it's the number at which half of people earn more and half of people earn less. The average (mean) figure is skewed to the high side because of a small number of very high earners.
Average Full-time Salary | Details | Median | Mean |
UK | £39,039 | £48,512 | |
England | £39,947 | £49,446 | |
England, ex-London | £37,473 | £44,159 | |
by region | |||
by region | North East | £34,403 | £39,859 |
by region | North West | £37,361 | £43,731 |
by region | Yorkshire Humber | £35,682 | £41,318 |
by region | East Mids | £35,600 | £41,178 |
by region | West Mids | £37,064 | £43,722 |
by region | East | £38,597 | £46,540 |
by region | London | £49,692 | £70,275 |
by region | South East | £39,983 | £47,619 |
by region | South West | £37,195 | £43,852 |
Wales | £35,796 | £40,626 | |
Scotland | £39,719 | £45,586 | |
N Ireland | £37,052 | £43,113 |
At £70,275 per year, you can see that average (mean) pay in London is the highest in the UK.
The average (mean) monthly salary is £3,820 per month in the UK for those working full time - it's £3,501 in England, excluding London, and £5,500 in London.
Monthly Salaries | Median | Mean |
England, ex-London | £3,680 | £3,123 |
London | £4,141 | £5,856 |
UK | £3,253 | £4,043 |
Average pay per hour in the UK varies for part-time and full-time work, with full-time workers earning close to 25% more per hour than part-time workers.
Of those working part-time, the average number of hours worked is 16.5 hours per week, according to the Labour Force Survey (LFS). Given that the average pay for part-time workers is £18,079 per year according to the Annual Survey of Hours and Earnings (ASHE), the average pay per hour for part-time work is around £21.07 per hour. The median pay for part-time work is £17.14 per hour.
Of those working full-time, the average number of hours worked is 36.5 hours per week, according to the Labour Force Survey (LFS). Given that the average pay for full-time workers is £48,512 per year according to the Annual Survey of Hours and Earnings (ASHE), the average pay per hour for full-time work is around £25.56 per hour. The median pay for full-time work is £20.57 per hour.
Hourly Pay UK | Mean | Median |
Full-time | £25.56 per hour | £20.57 per hour |
Part-time | £21.07 per hour | £17.14 per hour |
According to NimbleFins analysis of labour market data from the ONS, the average pay rise in 2025 was 9.1% for 2025 through October. This figure reflects average weekly earnings in Great Britain, seasonally adjusted.
'Household Disposable Income' is all of the money and benefits a household brings in after taxes - the amount the household has to spend and/or save each year.
'Household Disposable Income' refers to the sum total income received by all working members of a household, after taxes - essentially, it's all of the money and benefits a household has to spend and/or save each year.
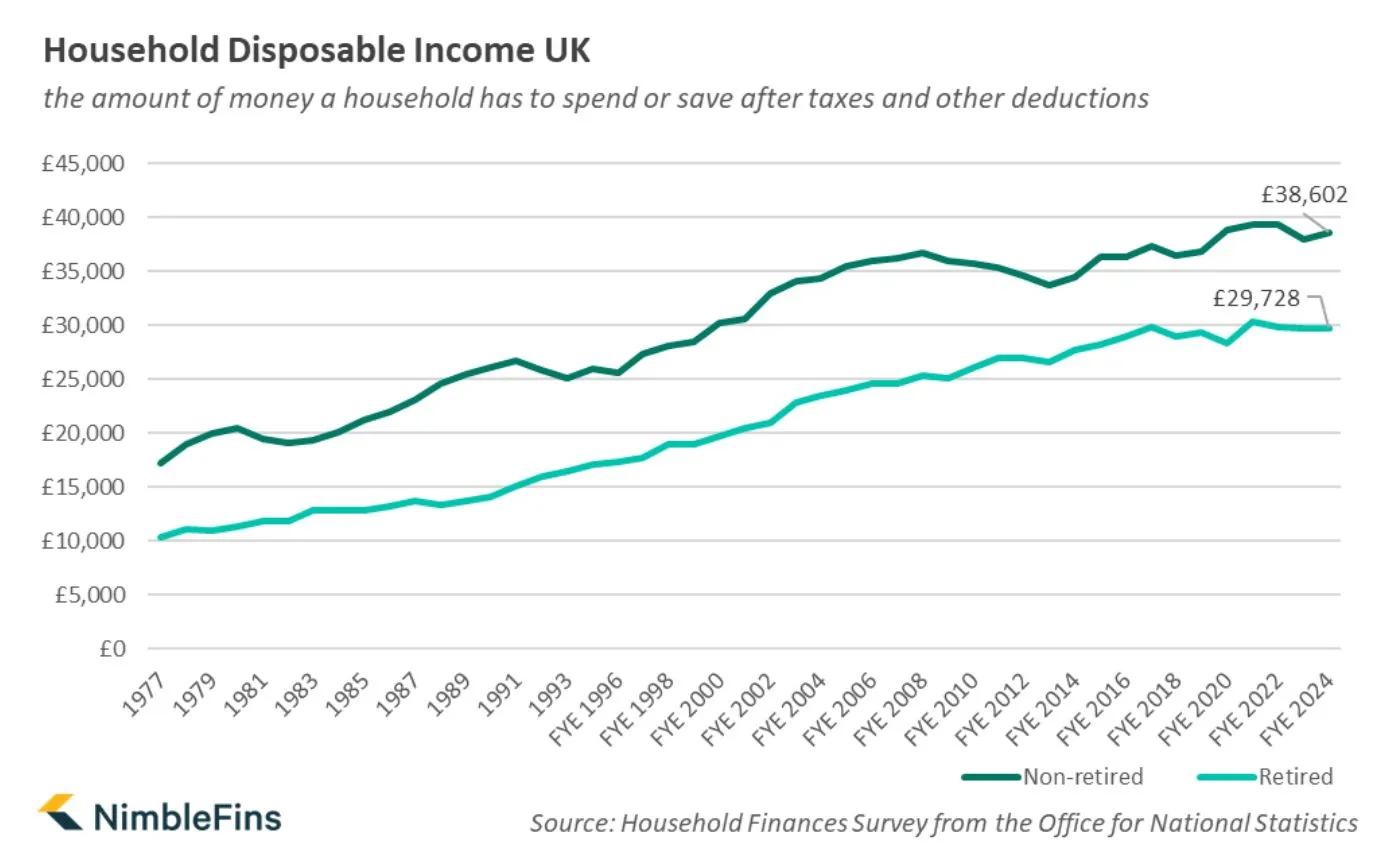
The average (mean) household disposable income in the UK is £42,684 - but the median household income is lower, at £36,663. The median reflects the income level where half of household bring in more (than £36,663), and half of households bring in less. The average (mean) is higher than the median because the mean is skewed upwards by a small number of people earning exceptionally high household incomes.
Household Disposable Income UK | Mean | Median |
All people | £42,684 | £36,663 |
Non-retired | £44,675 | £38,602 |
Retired | £32,691 | £29,728 |
In the past 10 years, the average (mean) household disposable income for all people has risen 2.7% from £41,582 to £42,684. In terms of median figures, household disposable incomes have risen 11.7% from £32,830 to £36,663 in the past 10 years.
Surprisingly, the 25 to 34 age bracket earns nearly as much as more experienced age brackets - with median disposable income of £38,378. But we suspect there's a logical reason for this - young professionals often flat share, so you could have a household bringing in 2, 3, 4 or more full-time salaries in that late 20s/early 30s age range.
Households where the main reference person is 55 to 60 years old are the highest earning. This makes sense to us - you're more likely to have a 'household' composed of families (not mates sharing a flat) and this is prime earning age for bringing in more income.
Household Disposable Income by Age Bracket (median) | Household Disposable Income by Age Bracket (median) |
18-24 | £24,190 |
25-34 | £38,378 |
35-44 | £36,021 |
45-54 | £38,490 |
55-64 | £40,377 |
65+ | £36,290 |
What's a typical mean income for 2 adults? Below, we've broken out the data for:
Earned income: wages, salaries, private pensions, investment income, etc.
Gross income: includes state pensions, direct benefits, etc.
Disposable income: after tax income a household has access to for living expenses or to save - and we show the data for each decile
There are ten deciles, with each decile representing 10% of the population. The bottom (1st) decile reflects income for the 10% of households earning the lowest income; the top (10th) decile reflects income for the 10% of households earning the highest income.
For example, the lowest 10% of earners bring in average gross income of just £13,654 (including pay and benefits), yielding disposable income of £10,725.
The highest 10% of earners bring in average income of £157,600 all in, which equates to £108,205 of after-tax disposable income for spending and saving.
Equivalised for a 2-adult, no-children household | Original income (wages, salaries, private pensions, investment income, etc.) | Gross income (includes state pensions and direct benefits) | Disposable income (after taxes) |
Bottom | £6,401 | £13,654 | £10,725 |
2nd | £12,770 | £22,515 | £19,647 |
3rd | £18,876 | £29,164 | £25,009 |
4th | £25,331 | £35,052 | £29,627 |
5th | £33,213 | £41,391 | £34,244 |
6th | £40,819 | £47,937 | £39,270 |
7th | £50,040 | £56,122 | £44,887 |
8th | £62,649 | £66,690 | £52,196 |
9th | £78,505 | £82,291 | £63,025 |
Top | £154,730 | £157,600 | £108,205 |
All individuals | £48,333 | £55,242 | £42,684 |
Retired households have around 30% less disposable income than non-retired households. As you can see below, the typical (median) retired household has £29,728 to spend and/or save each year, which is £8,874 less than the typical non-retired household, which has £38,602 of disposable income.
Male Londoners aged 50 - 59 earn the most money, with an average full-time pay of £97,513 per year. What's the highest paid job? Men working in financial and insurance activities earn an average of £105,881 across the UK (or £167,060 in London).
For comparison, for women, the highest earners are Londoners in the 40 - 49 year age bracket, who earn an average of £72,254 per year. Women who work in financial and insurance activities earn an average of £71,751 across the UK (or £114,774 in London).
Across the UK, it's now those working in finance and insurance activities who earn the most, with average full-time pay of £92,103 per year.
Full timers in information and communication jobs earn £64,833 on average.
Those working in electricity, gas, steam and air con supply earn an average of £61,656 per year.
Professional, scientific and technical activities earn full timers an average of £61,089 per year.
Those working in construction full time earn an average of £50,510, which beats those working in human health activities (£45,275).
Education professionals earn an average of £42,117 per year.
Average pay in the UK varies by gender. Men employed full time earn an average of £52,817 per year, which is 24% more than women, who earn an average of £42,636 per year for full-time work.
Women working part-time earn more each year than men, presumably because they put in more part-time hours than men.
Average Pay by Gender UK | Type | Median pay | Mean pay |
Full time | Male | £41,832 | £52,817 |
Full time | Female | £35,670 | £42,636 |
Part time | Male | £14,277 | £19,624 |
Part time | Female | £14,878 | £17,521 |
For those in full-time employment, the average (mean) salary in London is £70,275 per year. This 'average' number is skewed upwards by a small number of exceptionally high earners.
The typical salary in London is perhaps better reflected by the median London salary of £49,692. This figure reflects the salary at which half of Londoners earn more and half of Londoners earn less.
For those in full-time employment, NimbleFins calculates that the average (mean) salary in England is £49,446 per year. We calculated this figure using a weighted average (by number of full-time jobs per region) of mean salaries across the regions of England. Note, the 'mean' number is skewed upwards by a small number of exceptionally high earners, so it can also be useful to examine the median figure.
NimbleFins calculates that the typical (median) salary in England is £39,947. This figure reflects the salary at which half of those in England earn more and half earn less.
Excluding London, the average (mean) salary in England is £44,159 and the median salary is £37,473.
For those in full-time employment, the average (mean) salary in Scotland is £45,586 per year. This 'average' number is skewed upwards by a small number of exceptionally high earners.
The typical salary in Scotland is perhaps better reflected by the median Scottish salary of £39,719. This figure reflects the salary at which half of Scots earn more and half of Scots earn less.
The data used in this update uses the latest data available in January 2026, which reflects 2025 salaries.
Author
13 February 2026
8 min read
Contents
Average Salary UKAverage Hourly Pay UKAverage Household Income UKWho Earns the Most?Average Pay by Gender UKRegional Pay DifferencesThe guidance on this site is based on our own analysis and is meant to help you identify options and narrow down your choices. We do not advise or tell you which product to buy; undertake your own due diligence before entering into any agreement.
Author
Erin was the founder of NimbleFins, a data driven personal finance site. A former derivatives trader and finance expert at the Stanford Graduate School. Erin turns research into plain answers so you can understand your credit.
Author
13 February 2026
8 min read
Contents
Average Salary UKAverage Hourly Pay UKAverage Household Income UKWho Earns the Most?Average Pay by Gender UKRegional Pay DifferencesThe guidance on this site is based on our own analysis and is meant to help you identify options and narrow down your choices. We do not advise or tell you which product to buy; undertake your own due diligence before entering into any agreement.
For early 2026, the average full-time salary in the UK is £48,512, but there's much more detail to understand about pay beyond this headline figure. NimbleFins digs into official Office for National Statistics data to calculate average (mean) and median salaries for different regions, genders, types of work (full or part time) and more.
In addition to learning what jobs typically pay, our team also looks into disposable income figures for an entire household, to learn what people typically have at their disposal after taxes to spend and save.
The average full-time salary in the UK is £45,836 per annum. The median full-time salary in the UK is quite a bit lower, at £39,039. The median can be a better representation of a 'typical' figure because it's the number at which half of people earn more and half of people earn less. The average (mean) figure is skewed to the high side because of a small number of very high earners.
Average Full-time Salary | Details | Median | Mean |
UK | £39,039 | £48,512 | |
England | £39,947 | £49,446 | |
England, ex-London | £37,473 | £44,159 | |
by region | |||
by region | North East | £34,403 | £39,859 |
by region | North West | £37,361 | £43,731 |
by region | Yorkshire Humber | £35,682 | £41,318 |
by region | East Mids | £35,600 | £41,178 |
by region | West Mids | £37,064 | £43,722 |
by region | East | £38,597 | £46,540 |
by region | London | £49,692 | £70,275 |
by region | South East | £39,983 | £47,619 |
by region | South West | £37,195 | £43,852 |
Wales | £35,796 | £40,626 | |
Scotland | £39,719 | £45,586 | |
N Ireland | £37,052 | £43,113 |
At £70,275 per year, you can see that average (mean) pay in London is the highest in the UK.
The average (mean) monthly salary is £3,820 per month in the UK for those working full time - it's £3,501 in England, excluding London, and £5,500 in London.
Monthly Salaries | Median | Mean |
England, ex-London | £3,680 | £3,123 |
London | £4,141 | £5,856 |
UK | £3,253 | £4,043 |
Average pay per hour in the UK varies for part-time and full-time work, with full-time workers earning close to 25% more per hour than part-time workers.
Of those working part-time, the average number of hours worked is 16.5 hours per week, according to the Labour Force Survey (LFS). Given that the average pay for part-time workers is £18,079 per year according to the Annual Survey of Hours and Earnings (ASHE), the average pay per hour for part-time work is around £21.07 per hour. The median pay for part-time work is £17.14 per hour.
Of those working full-time, the average number of hours worked is 36.5 hours per week, according to the Labour Force Survey (LFS). Given that the average pay for full-time workers is £48,512 per year according to the Annual Survey of Hours and Earnings (ASHE), the average pay per hour for full-time work is around £25.56 per hour. The median pay for full-time work is £20.57 per hour.
Hourly Pay UK | Mean | Median |
Full-time | £25.56 per hour | £20.57 per hour |
Part-time | £21.07 per hour | £17.14 per hour |
According to NimbleFins analysis of labour market data from the ONS, the average pay rise in 2025 was 9.1% for 2025 through October. This figure reflects average weekly earnings in Great Britain, seasonally adjusted.
'Household Disposable Income' is all of the money and benefits a household brings in after taxes - the amount the household has to spend and/or save each year.
'Household Disposable Income' refers to the sum total income received by all working members of a household, after taxes - essentially, it's all of the money and benefits a household has to spend and/or save each year.
The average (mean) household disposable income in the UK is £42,684 - but the median household income is lower, at £36,663. The median reflects the income level where half of household bring in more (than £36,663), and half of households bring in less. The average (mean) is higher than the median because the mean is skewed upwards by a small number of people earning exceptionally high household incomes.
Household Disposable Income UK | Mean | Median |
All people | £42,684 | £36,663 |
Non-retired | £44,675 | £38,602 |
Retired | £32,691 | £29,728 |
In the past 10 years, the average (mean) household disposable income for all people has risen 2.7% from £41,582 to £42,684. In terms of median figures, household disposable incomes have risen 11.7% from £32,830 to £36,663 in the past 10 years.
Surprisingly, the 25 to 34 age bracket earns nearly as much as more experienced age brackets - with median disposable income of £38,378. But we suspect there's a logical reason for this - young professionals often flat share, so you could have a household bringing in 2, 3, 4 or more full-time salaries in that late 20s/early 30s age range.
Households where the main reference person is 55 to 60 years old are the highest earning. This makes sense to us - you're more likely to have a 'household' composed of families (not mates sharing a flat) and this is prime earning age for bringing in more income.
Household Disposable Income by Age Bracket (median) | Household Disposable Income by Age Bracket (median) |
18-24 | £24,190 |
25-34 | £38,378 |
35-44 | £36,021 |
45-54 | £38,490 |
55-64 | £40,377 |
65+ | £36,290 |
What's a typical mean income for 2 adults? Below, we've broken out the data for:
Earned income: wages, salaries, private pensions, investment income, etc.
Gross income: includes state pensions, direct benefits, etc.
Disposable income: after tax income a household has access to for living expenses or to save - and we show the data for each decile
There are ten deciles, with each decile representing 10% of the population. The bottom (1st) decile reflects income for the 10% of households earning the lowest income; the top (10th) decile reflects income for the 10% of households earning the highest income.
For example, the lowest 10% of earners bring in average gross income of just £13,654 (including pay and benefits), yielding disposable income of £10,725.
The highest 10% of earners bring in average income of £157,600 all in, which equates to £108,205 of after-tax disposable income for spending and saving.
Equivalised for a 2-adult, no-children household | Original income (wages, salaries, private pensions, investment income, etc.) | Gross income (includes state pensions and direct benefits) | Disposable income (after taxes) |
Bottom | £6,401 | £13,654 | £10,725 |
2nd | £12,770 | £22,515 | £19,647 |
3rd | £18,876 | £29,164 | £25,009 |
4th | £25,331 | £35,052 | £29,627 |
5th | £33,213 | £41,391 | £34,244 |
6th | £40,819 | £47,937 | £39,270 |
7th | £50,040 | £56,122 | £44,887 |
8th | £62,649 | £66,690 | £52,196 |
9th | £78,505 | £82,291 | £63,025 |
Top | £154,730 | £157,600 | £108,205 |
All individuals | £48,333 | £55,242 | £42,684 |
Retired households have around 30% less disposable income than non-retired households. As you can see below, the typical (median) retired household has £29,728 to spend and/or save each year, which is £8,874 less than the typical non-retired household, which has £38,602 of disposable income.
Male Londoners aged 50 - 59 earn the most money, with an average full-time pay of £97,513 per year. What's the highest paid job? Men working in financial and insurance activities earn an average of £105,881 across the UK (or £167,060 in London).
For comparison, for women, the highest earners are Londoners in the 40 - 49 year age bracket, who earn an average of £72,254 per year. Women who work in financial and insurance activities earn an average of £71,751 across the UK (or £114,774 in London).
Across the UK, it's now those working in finance and insurance activities who earn the most, with average full-time pay of £92,103 per year.
Full timers in information and communication jobs earn £64,833 on average.
Those working in electricity, gas, steam and air con supply earn an average of £61,656 per year.
Professional, scientific and technical activities earn full timers an average of £61,089 per year.
Those working in construction full time earn an average of £50,510, which beats those working in human health activities (£45,275).
Education professionals earn an average of £42,117 per year.
Average pay in the UK varies by gender. Men employed full time earn an average of £52,817 per year, which is 24% more than women, who earn an average of £42,636 per year for full-time work.
Women working part-time earn more each year than men, presumably because they put in more part-time hours than men.
Average Pay by Gender UK | Type | Median pay | Mean pay |
Full time | Male | £41,832 | £52,817 |
Full time | Female | £35,670 | £42,636 |
Part time | Male | £14,277 | £19,624 |
Part time | Female | £14,878 | £17,521 |
For those in full-time employment, the average (mean) salary in London is £70,275 per year. This 'average' number is skewed upwards by a small number of exceptionally high earners.
The typical salary in London is perhaps better reflected by the median London salary of £49,692. This figure reflects the salary at which half of Londoners earn more and half of Londoners earn less.
For those in full-time employment, NimbleFins calculates that the average (mean) salary in England is £49,446 per year. We calculated this figure using a weighted average (by number of full-time jobs per region) of mean salaries across the regions of England. Note, the 'mean' number is skewed upwards by a small number of exceptionally high earners, so it can also be useful to examine the median figure.
NimbleFins calculates that the typical (median) salary in England is £39,947. This figure reflects the salary at which half of those in England earn more and half earn less.
Excluding London, the average (mean) salary in England is £44,159 and the median salary is £37,473.
For those in full-time employment, the average (mean) salary in Scotland is £45,586 per year. This 'average' number is skewed upwards by a small number of exceptionally high earners.
The typical salary in Scotland is perhaps better reflected by the median Scottish salary of £39,719. This figure reflects the salary at which half of Scots earn more and half of Scots earn less.
The data used in this update uses the latest data available in January 2026, which reflects 2025 salaries.
Author
13 February 2026
8 min read
Contents
Average Salary UKAverage Hourly Pay UKAverage Household Income UKWho Earns the Most?Average Pay by Gender UKRegional Pay DifferencesThe guidance on this site is based on our own analysis and is meant to help you identify options and narrow down your choices. We do not advise or tell you which product to buy; undertake your own due diligence before entering into any agreement.
Author
Erin was the founder of NimbleFins, a data driven personal finance site. A former derivatives trader and finance expert at the Stanford Graduate School. Erin turns research into plain answers so you can understand your credit.