Erin Yurday
Author
Author
16 July 2026
21 min read
Contents
Average Food CostsFAQsHow Does Food & Drink Spending Vary across Income Groups?ShortcomingsCheap Eats: How to Save on FoodComparing Food Spend to Other Areas of the BudgetThe guidance on this site is based on our own analysis and is meant to help you identify options and narrow down your choices. We do not advise or tell you which product to buy; undertake your own due diligence before entering into any agreement.
According to NimbleFins analysis of family spending and inflation data from the Office of National Statistics, the average UK household now spends around £5,568 in total on food per year (£4,026 on groceries + £1,542 on food at restaurants and takeaways. This means that UK households spend ~16% of their budgets on food and non-alcoholic drinks. Another 3% or so of household budgets goes to alcohol, which you can read more about in our related article Average Spending on Alcohol in the UK.
In this study we’ll show the breakdown of household home food budgets per week and per month across food categories, typical amounts spent eating out and finally how food & drink budgets change with income levels and family sizes. Food prices in the UK rose again last year, making this an important budget category.
Please note that these figures reflect average amounts actually spent according to an ONS survey, adjusted up for inflation - they are not recommendations about how much anyone should spend. As you will see in this article, food spending varies a LOT from one household to another based on factors like income, size and makeup of the household, not to mention the type of food you buy (e.g. organic, gourmet, etc.) and more. You can get a sense of these wide spending ranges by viewing our poll results below (from tens of thousands of people!).
The average annual food cost for a typical UK household is around £5,568 (based on the average 2.3 people per household), including £358 spent on non-alcoholic drinks. The average weekly food cost for the typical UK household is around £107, up around 5.3% from a year ago. (Note: for the purposes of this article, "food" includes non-alcoholic drinks but not alcoholic drinks.) Food cost as a percentage of the average UK household budget has remained pretty steady for over fifteen years.
On average, we now spend about three quarters of our food budget on meals and snacks prepared and eaten at home (this has risen from around two-thirds in the past five years), and we spend one quarter of our food costs on eating out. So, households spend on average £4,026 a year on food for home (nearly the same as the cost to run a car) and £1,542 on takeaways, restaurants, cafés, snacks, etc.
Timeframe | Details | Per person | Per household |
Weekly | Food at Home | £34 | £77 |
Food Out (e.g., restaurants, take away, etc.) | £13 | £30 | |
Weekly Total | £47 | £107 | |
Per Year | Food at Home | £1,751 | £4,026 |
Food Out (e.g., restaurants, take away, etc.) | £670 | £1,542 | |
Annual Total | £2,421 | £5,568 |
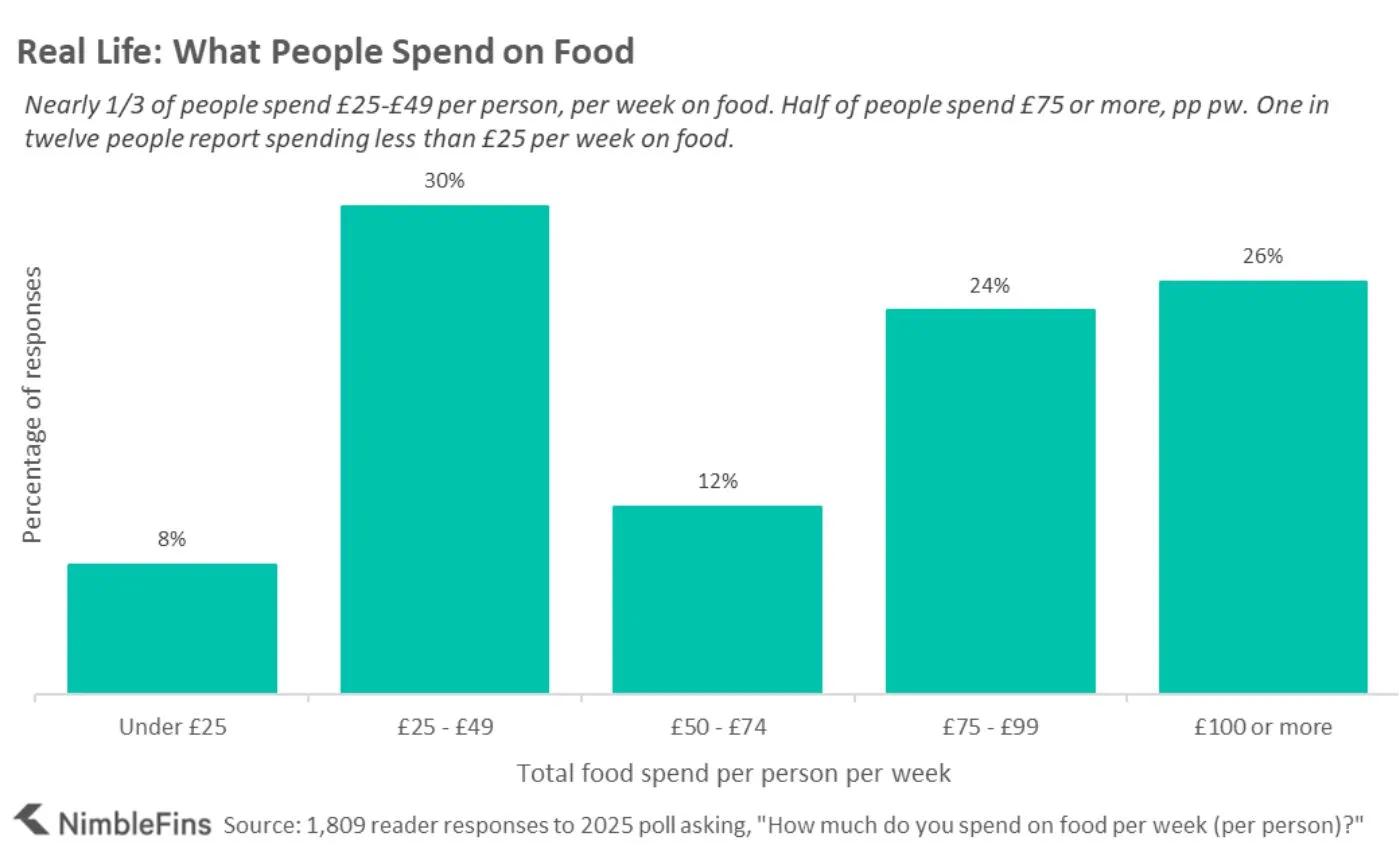
In 2025, over 1,800 NimbleFins readers filled in a poll to report their real-life food costs. We asked readers to give us their best guess as to the average weekly, per person food spend in their household - based on groceries, take aways and meals out.
The poll results show that nearly 1/3 of people spend £25-£49 per person per week (pppw) on food. One quarter of people spend in the range of £75 - £99 pppw on food; another quarter of people spend more than £100 pppw - this means that half of people spend £75 or more pppw on food. One in twelve people report spending less than £25 per week on food.
Weekly food spending range (per person) | Percentage of respondents |
Under £25 | 8% |
£25 - £49 | 30% |
£50 - £74 | 12% |
£75 - £99 | 24% |
£100 or more | 26% |
You can fill in the poll below to add to our dataset!
If you're wondering how much households like yours spend on food each week or month, below we break down weekly and monthly food bills for households of different sizes, based on expected caloric needs of different ages and genders.
^ Note, the 'per person' figure is averaged over men, women and children of all ages. Obviously, caloric needs vary. For example, a young, active man would have much higher caloric needs and would therefore spend more on food than, say, a typical woman or child. See more detail on foods costs by gender and age below. Also, the figures in this article reflect data from the most recent ONS Family Spending Report (April 2024 through March 2025), adjusted upwards for inflation through May 2026.
Analysing raw data from the Office for National Statistics, NimbleFins calculated a real-life (i.e. based on typical spending patterns across food categories) weighted average food inflation rate. The calculations show that the typical household is paying ~2.9% more for groceries compared to a year ago.
Food inflation rates largely dropped in the two years from the highest annualised rate of 17.5% in March 2023 to 2.4% in August 2024; since then, rates ticked upwards again only to start reducing in 2026. Latest figures from May 2026 showed a 2.9% change from the previous May. See the historical percentage changes in food prices over 12 months in the chart below.
Not surprisingly, food spending varies by region. Those in the South East spend around 8% more than the rest of the UK. Those in Northern Ireland spend the most: 17% more than average.
The lowest household food bills are enjoyed by those in the North East (13% less than average) and Yorkshire (5% less than average). You can find your region in the table below. Please note, these figures reflect estimates for food and non-alcoholic drink spending, per week.
Estimated Food & Non-Alcoholic Drink Spend, by region | Average weekly spend | How spend compares to UK |
North East | £63.7 | -13% |
Yorkshire and the Humber | £69.5 | -5% |
Scotland | £68.3 | -6% |
Wales | £69.6 | -4% |
London | £72.4 | -1% |
North West | £69.9 | -4% |
West Midlands | £69.9 | -4% |
East Midlands | £73.0 | 0% |
South West | £76.9 | 5% |
East | £78.2 | 7% |
South East | £78.4 | 8% |
Northern Ireland | £85.2 | 17% |
England | £73.2 | 0% |
United Kingdom | £72.9 | 0% |
Per Person: The average weekly food shop is £34 per person in the UK - but clearly caloric needs vary by age and gender. When you add £13 spent on food prepared out (e.g., restaurants and takeaways), the average weekly food bill for 1 person is £47.
Average Adult Man: The average adult male spends around £41 on groceries, £16 on food out and around £57 altogether on food each week.
Young, active adult man: A young, active adult man around 18 years of age whose caloric needs are 50% higher than the average person would theoretically spend around £70 a week on food (£50.5 on groceries and £19.3 out).
Average Adult Woman: The average adult female theoretically spends around £31 on groceries, £12 on food out and £43 altogether on food each week.
Young, active adult woman: A young, active adult woman around 18 years of age whose caloric needs are 25% higher than the average woman would theoretically spend around £65 a week on food (£46.8 on groceries and £17.9 out).
2 Adults: The average weekly food bill for 2 adults would be around £100 in total - £72 spent on the weekly food shop and £28 spent on food out.
Family of 3: The average weekly food bill for a family of 3 (two adults and one younger child) is around £137 - £99 spent on the weekly food shop and £38 spent on food out.
Family of 4: The typical family of 4 (two adults and 2 younger children) would spend around £174 each week on food - £126 on the weekly shop and £48 on restaurant and takeaway meals.
Family of 5: Larger families of 5 (two adults and 3 younger children) spend around £153 on the weekly shop and another £59 on food prepared out, bringing the total average food bill for a family of 5 to £212.
Family of 3 adults: Three adults (or two adults and one older teenager) would spend around £108 on groceries, £41 on food prepared out and £150 altogether on food each week, clearly with budget varying by the age and gender of the family members.
Average Cost of Food per Week | Grocery Shopping | Food Prepared Out | Total Food Bill |
Per Person | £33.7 | £12.9 | £46.6 |
Young, active adult male | £50.5 | £19.3 | £69.8 |
Average adult male | £40.9 | £15.7 | £56.6 |
Young, active adult female | £46.8 | £17.9 | £64.7 |
Average adult female | £31.2 | £11.9 | £43.1 |
Average child | £27.0 | £10.3 | £37.3 |
2 adults (1 man + 1 woman) | £72.1 | £27.6 | £99.7 |
2 adults + 1 child | £99.1 | £37.9 | £137.1 |
2 adults + 2 children | £126.1 | £48.3 | £174.4 |
2 adults + 3 children | £153.1 | £58.6 | £211.8 |
3 adults | £108.1 | £41.4 | £149.6 |
Since so many of our readers are looking for ways to save money on food, we researched different ways to get free (or cheap) food, which you can read about here.
Per Person: The average monthly food budget in the UK is £202 per person, of which £146 is spent on grocery shopping and £56 on food prepared out, such as takeaways and restaurant meals.
Average Adult Man: The average adult male would spend around £177 on groceries, £68 on food out and £245 altogether on food each month.
Young, active adult man: A young, active adult man around 18 years of age whose caloric needs are 50% higher than the average person would theoretically spend around £303 a month on food (£218.8 on groceries and £83.8 out).
Average Adult Woman: The average adult female would spend around £135 on groceries, £52 on food out and £187 altogether on food each month.
Young, active adult woman: A young, active adult woman around 18 years of age whose caloric needs are 25% higher than the average woman would theoretically spend around £280 a month on food (£202.7 on groceries and £77.6 out).
2 Adults: The total food budget for 2 adults in the UK is £432 per month - £312 on groceries and £120 on eating out.
Family of 3: The average food bill for a family of 3 (with two adults and one younger child) in the UK is around £594 per month - £430 of which is spent grocery shopping and £164 on takeaways and restaurants, and other eating out.
Family of 4: The average UK family of 4 (two adults and two younger children) spends £756 in total on food each month - £547 on grocery shopping bills and another £209 on food out.
Family of 5: Larger families of 5 (two adults and 3 younger children) spend around £664 a month on groceries and another £254 on food prepared out, bringing the total average food bill for a family of 5 to around £918.
Family of 3 adults: Three adults (or two adults and an older teenage child) would spend around £469 on groceries, £179 on food prepared out and £648 altogether on food each month, clearly with budget varying by the age and gender of the family members.
Please keep in mind these are theoretical figures base on expected caloric intake, using average per person figures as a starting point. We provide them to give a rough idea of what people typically spend. Your budget might (need to) be different.
Average Cost of Food per Month | Grocery Shopping | Food Prepared Out | Total Food Bill |
Per Person | £145.9 | £55.9 | £201.7 |
Young, active adult male | £218.8 | £83.8 | £302.6 |
Average adult male | £177.3 | £67.9 | £245.1 |
Young, active adult female | £202.7 | £77.6 | £280.4 |
Average adult female | £135.2 | £51.7 | £186.9 |
Average child | £117.0 | £44.8 | £161.8 |
2 adults (1 man + 1 woman) | £312.4 | £119.6 | £432.0 |
2 adults + 1 child | £429.5 | £164.4 | £593.9 |
2 adults + 2 children | £546.5 | £209.2 | £755.7 |
2 adults + 3 children | £663.5 | £254.0 | £917.6 |
3 adults | £468.6 | £179.4 | £648.1 |
When deciding how much you should spend on food, it can help to know that a person’s average spend on food in the UK is £47 per week or £202 per month, including groceries, takeaways and restaurants. However food needs vary by age and gender and so will food budgets - for example, an active young man can burn 50% more calories than the average person and would therefore spend more on food. Food consumes around 20% of a typical household’s budget (more than we spend on housing!). Most people spend 3/4 of this food budget on groceries and the other 1/4 on eating food prepared out.
The average spend on food per person is around £47 per week (£202 per month), including groceries and eating out - across all ages and genders. The average weekly food shop for 1 is £34 in the UK, plus we spend another £13 on eating out or ordering takeaways each week. But men consume more food and women less, so the average adult male spends around £57 a week (£245 a month) while women would spend around £43 a week (£187 a month).
The average monthly food budget for 2 adults in the UK is around £432; £312 of this is typically spent on groceries and £120 is spent on takeaways and restaurant meals. The average weekly shop for 2 adults in the UK costs £72.
The average monthly food budget for a family of 3 with two adults and one younger child under the age of 15 is around £594; £430 of this is spent on groceries and £164 is spent on takeaways and restaurant meals. The average weekly shop for a family of 3 in the UK costs £99.
The average monthly food bill for a family of 4 (two adults + 2 kids) in the UK is around £756; £547 of this is spent on groceries and £209 is spent on food prepared out of the house. The average weekly grocery bill for a family of 4 in the UK is £126.
Brits love processed meat, the food category that takes the biggest bite out of our household food budget. We spend a whopping 11% of our home food budget, or £435 a year, on sausages, bacon, ham and other processed meats. We spend less on fresh fruit (£239/year, including close to £90 on berries alone) and fresh vegetables (£264/year) than we do on cakes, buns and biscuits (£269/year).
Non-alcoholic drinks is another large part of our food budget, consuming around £358 a year, mostly on soft drinks. The categories that make up the largest proportions of the typical UK food budget at home would be familiar to most households. Keep in mind these are averages so, for example, spending £0.29 a week on jam doesn't mean buying a pot of jam for 29p - instead, it would be like buying one £1.50 jar of jam once every five weeks in real life.
Household Budget: Food at Home | Weekly Average | Annual Average |
Sausages, etc. | £8.37 | £435 |
Bread, rice and cereals | £6.59 | £343 |
Non-alcoholic drinks | £6.88 | £358 |
Fresh vegetables | £5.07 | £264 |
Fresh Fruit | £4.61 | £239 |
Buns, cakes, biscuits, etc. | £5.18 | £269 |
Fish | £3.18 | £166 |
Other sauces, herbs, etc. | £3.61 | £188 |
Potatoes and other tubers | £3.04 | £158 |
Poultry | £2.90 | £151 |
Yoghurt, etc | £2.94 | £153 |
Milk | £2.18 | £114 |
Cheese | £2.72 | £142 |
Beef | £2.90 | £151 |
Chocolate | £3.26 | £169 |
Dried or frozen vegetables | £2.36 | £123 |
Frozen, preserved & dried fruits and nuts | £1.95 | £102 |
Butter, margarine, cooking oils, etc. | £1.81 | £94 |
Bacon and ham | £0.79 | £41 |
Pastry (savoury) | £1.14 | £59 |
Confectionery products | £1.11 | £58 |
Eggs | £1.27 | £66 |
Pork | £0.64 | £33 |
Lamb | £0.68 | £35 |
Edible ices and ice cream | £0.93 | £48 |
Pasta | £0.61 | £32 |
Sugar | £0.39 | £20 |
Jams | £0.29 | £15 |
Total Spend: Household Food at Home | £77.43 | £4,026 |
Note, these figures include canteen and catering spending, which was not included in the figures mentioned above, since not all households have these expenses. For completeness, they are included here.
In addition to food, the weekly shop often includes household cleaning products like dish soap and laundry detergent, as well as personal products like soap and toothpaste. They're not cheap. How much do we really spend on these items?
An average household spends £39 a month on household cleaning and personal hygiene products in total. Cleaning materials account for £13 of this spending a month, while toiletries and soap take up another £12 per month. Another £9 is spent per month on kitchen disposables and toilet paper.
Spending on household cleaning and personal products | Per week | Per month | Per year |
Hair products | £1.0 | £4 | £54 |
Toilet paper | £1.0 | £4 | £54 |
Kitchen disposables (bin bags, kitchen roll, gloves, clothes, etc.) | £1.2 | £5 | £64 |
Toiletries and soap (razors, toothbrushes, toothpaste, soap, etc.) | £2.7 | £12 | £139 |
Cleaning materials (detergents, washing-up liquid, washing powder, polishes, etc.) | £3.1 | £13 | £160 |
Total cleaning and personal hygiene | £9.1 | £39 | £471 |
On a weekly basis, households typically spend around £9.1 on these household and personal hygiene items. Over the course of a year, this totals to around £471. It really adds up.
The highest earning households with equivalised disposable (after-tax) incomes over £118,560 per year spend 3.2 times as much per year on food and non-alcoholic drinks compared to the lowest earning families with incomes under £15,808. The households earning the most (top decile) spend £8,853 per year while the households earning the least (lowest decile) spend £2,809 per year on food.
Not surprisingly, the lower income groups spend a higher proportion of their total household expenditures on food and drinks: around 19%. Compare this to the highest earning decile, where households only spend 13% of their total budget on food and non-alcoholic drinks. We all need to eat and this budget area can only be cut so much. As a result, a higher percentage of disposable income must go towards the food budget for the lowest earners.
Wealthier families spend a greater proportion of their total food and non-alcoholic drink budget - 36% - on food and non-alcoholic drinks away from home, which includes restaurant meals and takeaways. Those on smaller budgets tend to save money by eating at home more, spending ~80% of their food and drink budgets for consumption at home and only ~20% of their food and drink budgets out at restaurants and on take aways.
In terms of actual spending, you can see how weekly food and drink budgets increase as disposable incomes rise. The wealthier dine out more, the budget-constricted eat at home more.
In the past, we have based our figures strictly on the most recent Family Spending report from the ONS. However, in light of the fact that the latest ONS report is for the period April 2024 through March 2025 (ending over a year ago) and food inflation in the UK has been significant, we've adjusted the figures in this article for inflation from the time period of the ONS Family Spending report until May 2026.
These are our best guesses as to current spending, but please keep in mind that they are estimates.
Note, we did not ramp figures up by inflation stats for the last section, food spending by income. We suspect that inflation is impacting household spending differently depending on a household's income level; at the time of this update, it didn't seem right to create figures for that section using one inflation figure. Since the real point of that section is to show differences across income levels, not necessarily exact figures, we have left the year-end 2024 figures as is. In reality, all households will be spending more on food now across income levels.
Separately, to calculate food costs per person and for different household sizes, we had to take into account the different caloric needs of people of different ages and genders. For example, a young, active male would burn around 3,200 calories worth of food a day while a typical 5-year-old child would burn just 1,400 calories a day. And the more food you eat, the more it costs you.
To estimate these figures, we first calculated the weighted average caloric needs of the UK population, and divided the average spending for a household by the average number of people in a household (2.3) to get a per person (average) food budget. Then we tweaked this average 'per person' number to reflect the caloric needs of different ages and genders. We multiplied these per-person figures by the relevant caloric needs and added up the people in a household to find the budget for different families. See below for an example of our calculations. Calorie need figures were sourced here.
Category | Average caloric needs | Difference from average | Weekly food shop | Weekly cost of food prepared out | Average food costs per week |
Per Person | 2128 | 0 | £33.7 | £12.9 | £46.6 |
Adult Male (age 16+) | 2586 | 0.22 | £40.9 | £15.7 | £56.6 |
Young, active adult male | 3200 | 0.5 | £50.5 | £19.3 | £69.8 |
Adult Female (Age 16+) | 1971 | -0.07 | £31.2 | £11.9 | £43.1 |
Young, active adult female | 2400 | 0.13 | £46.8 | £17.9 | £64.7 |
Child (ages 2 - 15) | 1707 | -0.2 | £27.0 | £10.3 | £37.3 |
While this attempts to take into account different food needs for family members of different ages and genders, please keep in mind that these are estimates. And the calculations don't take into account savings that larger families can achieve by buying in bulk, or that some families are a lot more budget conscious than others. If you have people in your family who eat less (e.g., a really small child) or are an efficient shopper who is careful with prices and takes advantage of sales or buying in bulk (e.g., to feed a large family) then keep this in mind when comparing your own spending to the figures presented here.
Whatever your food budget, you can probably borrow some tips from thrifty households to reduce costs down even further. Try to work these methods into your family’s food plan.
1. Cook at home
It does take more time, but cooking and eating at home can save loads of money over the long run. Consider that the actual cost of food for a restaurant meal is less than a third of what you pay for it. The rest of the money you spend at a restaurant goes to other costs like labor and overhead. If you cook at home, you only pay the food cost, and pocket the rest. Team up with your partner, child or a friend to create great food and memories.
2. Stock up on staples
Buy big. Packages, that is. Stores usually charge less per unit (kg, litre, etc.) when you buy more at a time. This means that a 2 kg bag of rice will cost less per kilo than a 0.5 kg bag of rice. If you live near a warehouse store like Costco, consider becoming a member. There you'll have a better chance of finding the largest food packages (e.g., American sizes).
3. Swap pricey proteins or goods for cheaper ones
Ground beef costs less per pound than steaks. Chicken thighs cost less than chicken breasts (and are juicier!). Include lots of dried beans into your meals to add protein and fill your family. Be on the look out for discounted food that the grocery store needs to sell that day due to an impending expiration date - just be sure to cook it ASAP!
Another way to reduce your food budget is by taking a look at your non-alcoholic beverages spend. The average UK family spends a whopping 8% of their at-home food budget on coffee, tea, juices, mineral/sparkling water and sodas. While we'd never suggest eliminating your daily cuppa (coffee and tea aren't the budget problem anyway), there is really no room for soda, juice and fancy water in a tight budget. We have two words for you: tap water.
If you don't like the taste of the life-saving liquid that flows plentifully from your tap, try squeezing in some lemon or boiling it into tea. We try to keep a pitcher of homemade iced herbal tea in the fridge - tastes great, cheap and has no sugar or sugar substitutes. Buying cappuccino at chains like Starbucks or Costa everyday, while convenient, can easily total £1,000 a year, based on our calculations. Instant coffee with a dash of cinnamon or chocolate on top is an easy and impressive alternative.
Food and drink may be necessary for life, but a few small tweaks can help you spend less on them.
In addition to the steps above, if you're struggling with the budget it can be handy to have a deep dive into your current household spending. People are often surprised when they run the numbers over a month and realise how much they spend on expensive food items like takeaways or coffee-shop coffee. For example, spending £40 on a weekly pizza takeaway, including soda and appetizers, adds up to over £2,000 a year! Popping a few frozen grocery store pizzas in the oven will cost less than half the price.
To understand your food spending you can sit down with pen and paper and go through your bank statements and credit card bills once a month. Alternatively, there are a number of handy tech resources at our disposal these days.
For example, Money Dashboard is a personal finance app where you can easily view all your accounts and track your spending by category - they have separate pre-set categories including 'groceries' and 'food & drink', which tracks money spent eating out. Money Dashboard is rated 4.9 out of 5 stars by existing customers and is free to use. Budgeting apps like this (there are a number of others in the market, including Emma and Plum) can be a great resource if you're watching your spending.
While food is clearly a large budget item, there are a few categories that take an even larger bite of the average annual household budget. The average UK household also spends over £4,750 on transportation costs (including related insurance) and a whopping £10,600 on all things housing. Our largest utility cost is gas and electricity. The average UK household spent another £1,800 or so per year on gas and electricity in 2025. The cost to light, heat and run our homes accounts for close to 5% of our household budgets each year.
If your household buys in bulk to save money and keeps a large store of food in the freezer, especially expensive items like meat, you might want to check your home insurance policy to see if freezer contents are covered. Policies that include freezer food will reimburse you up to a certain amount (e.g., £1,000) if, for instance, you lose the contents of your freezer due to an electrical failure or your freezer breaking down.
Note: Updated in July 2026 to reflect the most recent Living Costs and Food Survey from the ONS and recent inflation statistics through May 2026. The data here are estimates as to typical food spending; please use these figures for informational purposes only.
Author
16 July 2026
21 min read
Contents
Average Food CostsFAQsHow Does Food & Drink Spending Vary across Income Groups?ShortcomingsCheap Eats: How to Save on FoodComparing Food Spend to Other Areas of the BudgetThe guidance on this site is based on our own analysis and is meant to help you identify options and narrow down your choices. We do not advise or tell you which product to buy; undertake your own due diligence before entering into any agreement.
Author
Erin was the founder of NimbleFins, a data driven personal finance site. A former derivatives trader and finance expert at the Stanford Graduate School. Erin turns research into plain answers so you can understand your credit.
Author
16 July 2026
21 min read
Contents
Average Food CostsFAQsHow Does Food & Drink Spending Vary across Income Groups?ShortcomingsCheap Eats: How to Save on FoodComparing Food Spend to Other Areas of the BudgetThe guidance on this site is based on our own analysis and is meant to help you identify options and narrow down your choices. We do not advise or tell you which product to buy; undertake your own due diligence before entering into any agreement.
According to NimbleFins analysis of family spending and inflation data from the Office of National Statistics, the average UK household now spends around £5,568 in total on food per year (£4,026 on groceries + £1,542 on food at restaurants and takeaways. This means that UK households spend ~16% of their budgets on food and non-alcoholic drinks. Another 3% or so of household budgets goes to alcohol, which you can read more about in our related article Average Spending on Alcohol in the UK.
In this study we’ll show the breakdown of household home food budgets per week and per month across food categories, typical amounts spent eating out and finally how food & drink budgets change with income levels and family sizes. Food prices in the UK rose again last year, making this an important budget category.
Please note that these figures reflect average amounts actually spent according to an ONS survey, adjusted up for inflation - they are not recommendations about how much anyone should spend. As you will see in this article, food spending varies a LOT from one household to another based on factors like income, size and makeup of the household, not to mention the type of food you buy (e.g. organic, gourmet, etc.) and more. You can get a sense of these wide spending ranges by viewing our poll results below (from tens of thousands of people!).
The average annual food cost for a typical UK household is around £5,568 (based on the average 2.3 people per household), including £358 spent on non-alcoholic drinks. The average weekly food cost for the typical UK household is around £107, up around 5.3% from a year ago. (Note: for the purposes of this article, "food" includes non-alcoholic drinks but not alcoholic drinks.) Food cost as a percentage of the average UK household budget has remained pretty steady for over fifteen years.
On average, we now spend about three quarters of our food budget on meals and snacks prepared and eaten at home (this has risen from around two-thirds in the past five years), and we spend one quarter of our food costs on eating out. So, households spend on average £4,026 a year on food for home (nearly the same as the cost to run a car) and £1,542 on takeaways, restaurants, cafés, snacks, etc.
Timeframe | Details | Per person | Per household |
Weekly | Food at Home | £34 | £77 |
Food Out (e.g., restaurants, take away, etc.) | £13 | £30 | |
Weekly Total | £47 | £107 | |
Per Year | Food at Home | £1,751 | £4,026 |
Food Out (e.g., restaurants, take away, etc.) | £670 | £1,542 | |
Annual Total | £2,421 | £5,568 |
In 2025, over 1,800 NimbleFins readers filled in a poll to report their real-life food costs. We asked readers to give us their best guess as to the average weekly, per person food spend in their household - based on groceries, take aways and meals out.
The poll results show that nearly 1/3 of people spend £25-£49 per person per week (pppw) on food. One quarter of people spend in the range of £75 - £99 pppw on food; another quarter of people spend more than £100 pppw - this means that half of people spend £75 or more pppw on food. One in twelve people report spending less than £25 per week on food.
Weekly food spending range (per person) | Percentage of respondents |
Under £25 | 8% |
£25 - £49 | 30% |
£50 - £74 | 12% |
£75 - £99 | 24% |
£100 or more | 26% |
You can fill in the poll below to add to our dataset!
If you're wondering how much households like yours spend on food each week or month, below we break down weekly and monthly food bills for households of different sizes, based on expected caloric needs of different ages and genders.
^ Note, the 'per person' figure is averaged over men, women and children of all ages. Obviously, caloric needs vary. For example, a young, active man would have much higher caloric needs and would therefore spend more on food than, say, a typical woman or child. See more detail on foods costs by gender and age below. Also, the figures in this article reflect data from the most recent ONS Family Spending Report (April 2024 through March 2025), adjusted upwards for inflation through May 2026.
Analysing raw data from the Office for National Statistics, NimbleFins calculated a real-life (i.e. based on typical spending patterns across food categories) weighted average food inflation rate. The calculations show that the typical household is paying ~2.9% more for groceries compared to a year ago.
Food inflation rates largely dropped in the two years from the highest annualised rate of 17.5% in March 2023 to 2.4% in August 2024; since then, rates ticked upwards again only to start reducing in 2026. Latest figures from May 2026 showed a 2.9% change from the previous May. See the historical percentage changes in food prices over 12 months in the chart below.
Not surprisingly, food spending varies by region. Those in the South East spend around 8% more than the rest of the UK. Those in Northern Ireland spend the most: 17% more than average.
The lowest household food bills are enjoyed by those in the North East (13% less than average) and Yorkshire (5% less than average). You can find your region in the table below. Please note, these figures reflect estimates for food and non-alcoholic drink spending, per week.
Estimated Food & Non-Alcoholic Drink Spend, by region | Average weekly spend | How spend compares to UK |
North East | £63.7 | -13% |
Yorkshire and the Humber | £69.5 | -5% |
Scotland | £68.3 | -6% |
Wales | £69.6 | -4% |
London | £72.4 | -1% |
North West | £69.9 | -4% |
West Midlands | £69.9 | -4% |
East Midlands | £73.0 | 0% |
South West | £76.9 | 5% |
East | £78.2 | 7% |
South East | £78.4 | 8% |
Northern Ireland | £85.2 | 17% |
England | £73.2 | 0% |
United Kingdom | £72.9 | 0% |
Per Person: The average weekly food shop is £34 per person in the UK - but clearly caloric needs vary by age and gender. When you add £13 spent on food prepared out (e.g., restaurants and takeaways), the average weekly food bill for 1 person is £47.
Average Adult Man: The average adult male spends around £41 on groceries, £16 on food out and around £57 altogether on food each week.
Young, active adult man: A young, active adult man around 18 years of age whose caloric needs are 50% higher than the average person would theoretically spend around £70 a week on food (£50.5 on groceries and £19.3 out).
Average Adult Woman: The average adult female theoretically spends around £31 on groceries, £12 on food out and £43 altogether on food each week.
Young, active adult woman: A young, active adult woman around 18 years of age whose caloric needs are 25% higher than the average woman would theoretically spend around £65 a week on food (£46.8 on groceries and £17.9 out).
2 Adults: The average weekly food bill for 2 adults would be around £100 in total - £72 spent on the weekly food shop and £28 spent on food out.
Family of 3: The average weekly food bill for a family of 3 (two adults and one younger child) is around £137 - £99 spent on the weekly food shop and £38 spent on food out.
Family of 4: The typical family of 4 (two adults and 2 younger children) would spend around £174 each week on food - £126 on the weekly shop and £48 on restaurant and takeaway meals.
Family of 5: Larger families of 5 (two adults and 3 younger children) spend around £153 on the weekly shop and another £59 on food prepared out, bringing the total average food bill for a family of 5 to £212.
Family of 3 adults: Three adults (or two adults and one older teenager) would spend around £108 on groceries, £41 on food prepared out and £150 altogether on food each week, clearly with budget varying by the age and gender of the family members.
Average Cost of Food per Week | Grocery Shopping | Food Prepared Out | Total Food Bill |
Per Person | £33.7 | £12.9 | £46.6 |
Young, active adult male | £50.5 | £19.3 | £69.8 |
Average adult male | £40.9 | £15.7 | £56.6 |
Young, active adult female | £46.8 | £17.9 | £64.7 |
Average adult female | £31.2 | £11.9 | £43.1 |
Average child | £27.0 | £10.3 | £37.3 |
2 adults (1 man + 1 woman) | £72.1 | £27.6 | £99.7 |
2 adults + 1 child | £99.1 | £37.9 | £137.1 |
2 adults + 2 children | £126.1 | £48.3 | £174.4 |
2 adults + 3 children | £153.1 | £58.6 | £211.8 |
3 adults | £108.1 | £41.4 | £149.6 |
Since so many of our readers are looking for ways to save money on food, we researched different ways to get free (or cheap) food, which you can read about here.
Per Person: The average monthly food budget in the UK is £202 per person, of which £146 is spent on grocery shopping and £56 on food prepared out, such as takeaways and restaurant meals.
Average Adult Man: The average adult male would spend around £177 on groceries, £68 on food out and £245 altogether on food each month.
Young, active adult man: A young, active adult man around 18 years of age whose caloric needs are 50% higher than the average person would theoretically spend around £303 a month on food (£218.8 on groceries and £83.8 out).
Average Adult Woman: The average adult female would spend around £135 on groceries, £52 on food out and £187 altogether on food each month.
Young, active adult woman: A young, active adult woman around 18 years of age whose caloric needs are 25% higher than the average woman would theoretically spend around £280 a month on food (£202.7 on groceries and £77.6 out).
2 Adults: The total food budget for 2 adults in the UK is £432 per month - £312 on groceries and £120 on eating out.
Family of 3: The average food bill for a family of 3 (with two adults and one younger child) in the UK is around £594 per month - £430 of which is spent grocery shopping and £164 on takeaways and restaurants, and other eating out.
Family of 4: The average UK family of 4 (two adults and two younger children) spends £756 in total on food each month - £547 on grocery shopping bills and another £209 on food out.
Family of 5: Larger families of 5 (two adults and 3 younger children) spend around £664 a month on groceries and another £254 on food prepared out, bringing the total average food bill for a family of 5 to around £918.
Family of 3 adults: Three adults (or two adults and an older teenage child) would spend around £469 on groceries, £179 on food prepared out and £648 altogether on food each month, clearly with budget varying by the age and gender of the family members.
Please keep in mind these are theoretical figures base on expected caloric intake, using average per person figures as a starting point. We provide them to give a rough idea of what people typically spend. Your budget might (need to) be different.
Average Cost of Food per Month | Grocery Shopping | Food Prepared Out | Total Food Bill |
Per Person | £145.9 | £55.9 | £201.7 |
Young, active adult male | £218.8 | £83.8 | £302.6 |
Average adult male | £177.3 | £67.9 | £245.1 |
Young, active adult female | £202.7 | £77.6 | £280.4 |
Average adult female | £135.2 | £51.7 | £186.9 |
Average child | £117.0 | £44.8 | £161.8 |
2 adults (1 man + 1 woman) | £312.4 | £119.6 | £432.0 |
2 adults + 1 child | £429.5 | £164.4 | £593.9 |
2 adults + 2 children | £546.5 | £209.2 | £755.7 |
2 adults + 3 children | £663.5 | £254.0 | £917.6 |
3 adults | £468.6 | £179.4 | £648.1 |
When deciding how much you should spend on food, it can help to know that a person’s average spend on food in the UK is £47 per week or £202 per month, including groceries, takeaways and restaurants. However food needs vary by age and gender and so will food budgets - for example, an active young man can burn 50% more calories than the average person and would therefore spend more on food. Food consumes around 20% of a typical household’s budget (more than we spend on housing!). Most people spend 3/4 of this food budget on groceries and the other 1/4 on eating food prepared out.
The average spend on food per person is around £47 per week (£202 per month), including groceries and eating out - across all ages and genders. The average weekly food shop for 1 is £34 in the UK, plus we spend another £13 on eating out or ordering takeaways each week. But men consume more food and women less, so the average adult male spends around £57 a week (£245 a month) while women would spend around £43 a week (£187 a month).
The average monthly food budget for 2 adults in the UK is around £432; £312 of this is typically spent on groceries and £120 is spent on takeaways and restaurant meals. The average weekly shop for 2 adults in the UK costs £72.
The average monthly food budget for a family of 3 with two adults and one younger child under the age of 15 is around £594; £430 of this is spent on groceries and £164 is spent on takeaways and restaurant meals. The average weekly shop for a family of 3 in the UK costs £99.
The average monthly food bill for a family of 4 (two adults + 2 kids) in the UK is around £756; £547 of this is spent on groceries and £209 is spent on food prepared out of the house. The average weekly grocery bill for a family of 4 in the UK is £126.
Brits love processed meat, the food category that takes the biggest bite out of our household food budget. We spend a whopping 11% of our home food budget, or £435 a year, on sausages, bacon, ham and other processed meats. We spend less on fresh fruit (£239/year, including close to £90 on berries alone) and fresh vegetables (£264/year) than we do on cakes, buns and biscuits (£269/year).
Non-alcoholic drinks is another large part of our food budget, consuming around £358 a year, mostly on soft drinks. The categories that make up the largest proportions of the typical UK food budget at home would be familiar to most households. Keep in mind these are averages so, for example, spending £0.29 a week on jam doesn't mean buying a pot of jam for 29p - instead, it would be like buying one £1.50 jar of jam once every five weeks in real life.
Household Budget: Food at Home | Weekly Average | Annual Average |
Sausages, etc. | £8.37 | £435 |
Bread, rice and cereals | £6.59 | £343 |
Non-alcoholic drinks | £6.88 | £358 |
Fresh vegetables | £5.07 | £264 |
Fresh Fruit | £4.61 | £239 |
Buns, cakes, biscuits, etc. | £5.18 | £269 |
Fish | £3.18 | £166 |
Other sauces, herbs, etc. | £3.61 | £188 |
Potatoes and other tubers | £3.04 | £158 |
Poultry | £2.90 | £151 |
Yoghurt, etc | £2.94 | £153 |
Milk | £2.18 | £114 |
Cheese | £2.72 | £142 |
Beef | £2.90 | £151 |
Chocolate | £3.26 | £169 |
Dried or frozen vegetables | £2.36 | £123 |
Frozen, preserved & dried fruits and nuts | £1.95 | £102 |
Butter, margarine, cooking oils, etc. | £1.81 | £94 |
Bacon and ham | £0.79 | £41 |
Pastry (savoury) | £1.14 | £59 |
Confectionery products | £1.11 | £58 |
Eggs | £1.27 | £66 |
Pork | £0.64 | £33 |
Lamb | £0.68 | £35 |
Edible ices and ice cream | £0.93 | £48 |
Pasta | £0.61 | £32 |
Sugar | £0.39 | £20 |
Jams | £0.29 | £15 |
Total Spend: Household Food at Home | £77.43 | £4,026 |
Note, these figures include canteen and catering spending, which was not included in the figures mentioned above, since not all households have these expenses. For completeness, they are included here.
In addition to food, the weekly shop often includes household cleaning products like dish soap and laundry detergent, as well as personal products like soap and toothpaste. They're not cheap. How much do we really spend on these items?
An average household spends £39 a month on household cleaning and personal hygiene products in total. Cleaning materials account for £13 of this spending a month, while toiletries and soap take up another £12 per month. Another £9 is spent per month on kitchen disposables and toilet paper.
Spending on household cleaning and personal products | Per week | Per month | Per year |
Hair products | £1.0 | £4 | £54 |
Toilet paper | £1.0 | £4 | £54 |
Kitchen disposables (bin bags, kitchen roll, gloves, clothes, etc.) | £1.2 | £5 | £64 |
Toiletries and soap (razors, toothbrushes, toothpaste, soap, etc.) | £2.7 | £12 | £139 |
Cleaning materials (detergents, washing-up liquid, washing powder, polishes, etc.) | £3.1 | £13 | £160 |
Total cleaning and personal hygiene | £9.1 | £39 | £471 |
On a weekly basis, households typically spend around £9.1 on these household and personal hygiene items. Over the course of a year, this totals to around £471. It really adds up.
The highest earning households with equivalised disposable (after-tax) incomes over £118,560 per year spend 3.2 times as much per year on food and non-alcoholic drinks compared to the lowest earning families with incomes under £15,808. The households earning the most (top decile) spend £8,853 per year while the households earning the least (lowest decile) spend £2,809 per year on food.
Not surprisingly, the lower income groups spend a higher proportion of their total household expenditures on food and drinks: around 19%. Compare this to the highest earning decile, where households only spend 13% of their total budget on food and non-alcoholic drinks. We all need to eat and this budget area can only be cut so much. As a result, a higher percentage of disposable income must go towards the food budget for the lowest earners.
Wealthier families spend a greater proportion of their total food and non-alcoholic drink budget - 36% - on food and non-alcoholic drinks away from home, which includes restaurant meals and takeaways. Those on smaller budgets tend to save money by eating at home more, spending ~80% of their food and drink budgets for consumption at home and only ~20% of their food and drink budgets out at restaurants and on take aways.
In terms of actual spending, you can see how weekly food and drink budgets increase as disposable incomes rise. The wealthier dine out more, the budget-constricted eat at home more.
In the past, we have based our figures strictly on the most recent Family Spending report from the ONS. However, in light of the fact that the latest ONS report is for the period April 2024 through March 2025 (ending over a year ago) and food inflation in the UK has been significant, we've adjusted the figures in this article for inflation from the time period of the ONS Family Spending report until May 2026.
These are our best guesses as to current spending, but please keep in mind that they are estimates.
Note, we did not ramp figures up by inflation stats for the last section, food spending by income. We suspect that inflation is impacting household spending differently depending on a household's income level; at the time of this update, it didn't seem right to create figures for that section using one inflation figure. Since the real point of that section is to show differences across income levels, not necessarily exact figures, we have left the year-end 2024 figures as is. In reality, all households will be spending more on food now across income levels.
Separately, to calculate food costs per person and for different household sizes, we had to take into account the different caloric needs of people of different ages and genders. For example, a young, active male would burn around 3,200 calories worth of food a day while a typical 5-year-old child would burn just 1,400 calories a day. And the more food you eat, the more it costs you.
To estimate these figures, we first calculated the weighted average caloric needs of the UK population, and divided the average spending for a household by the average number of people in a household (2.3) to get a per person (average) food budget. Then we tweaked this average 'per person' number to reflect the caloric needs of different ages and genders. We multiplied these per-person figures by the relevant caloric needs and added up the people in a household to find the budget for different families. See below for an example of our calculations. Calorie need figures were sourced here.
Category | Average caloric needs | Difference from average | Weekly food shop | Weekly cost of food prepared out | Average food costs per week |
Per Person | 2128 | 0 | £33.7 | £12.9 | £46.6 |
Adult Male (age 16+) | 2586 | 0.22 | £40.9 | £15.7 | £56.6 |
Young, active adult male | 3200 | 0.5 | £50.5 | £19.3 | £69.8 |
Adult Female (Age 16+) | 1971 | -0.07 | £31.2 | £11.9 | £43.1 |
Young, active adult female | 2400 | 0.13 | £46.8 | £17.9 | £64.7 |
Child (ages 2 - 15) | 1707 | -0.2 | £27.0 | £10.3 | £37.3 |
While this attempts to take into account different food needs for family members of different ages and genders, please keep in mind that these are estimates. And the calculations don't take into account savings that larger families can achieve by buying in bulk, or that some families are a lot more budget conscious than others. If you have people in your family who eat less (e.g., a really small child) or are an efficient shopper who is careful with prices and takes advantage of sales or buying in bulk (e.g., to feed a large family) then keep this in mind when comparing your own spending to the figures presented here.
Whatever your food budget, you can probably borrow some tips from thrifty households to reduce costs down even further. Try to work these methods into your family’s food plan.
1. Cook at home
It does take more time, but cooking and eating at home can save loads of money over the long run. Consider that the actual cost of food for a restaurant meal is less than a third of what you pay for it. The rest of the money you spend at a restaurant goes to other costs like labor and overhead. If you cook at home, you only pay the food cost, and pocket the rest. Team up with your partner, child or a friend to create great food and memories.
2. Stock up on staples
Buy big. Packages, that is. Stores usually charge less per unit (kg, litre, etc.) when you buy more at a time. This means that a 2 kg bag of rice will cost less per kilo than a 0.5 kg bag of rice. If you live near a warehouse store like Costco, consider becoming a member. There you'll have a better chance of finding the largest food packages (e.g., American sizes).
3. Swap pricey proteins or goods for cheaper ones
Ground beef costs less per pound than steaks. Chicken thighs cost less than chicken breasts (and are juicier!). Include lots of dried beans into your meals to add protein and fill your family. Be on the look out for discounted food that the grocery store needs to sell that day due to an impending expiration date - just be sure to cook it ASAP!
Another way to reduce your food budget is by taking a look at your non-alcoholic beverages spend. The average UK family spends a whopping 8% of their at-home food budget on coffee, tea, juices, mineral/sparkling water and sodas. While we'd never suggest eliminating your daily cuppa (coffee and tea aren't the budget problem anyway), there is really no room for soda, juice and fancy water in a tight budget. We have two words for you: tap water.
If you don't like the taste of the life-saving liquid that flows plentifully from your tap, try squeezing in some lemon or boiling it into tea. We try to keep a pitcher of homemade iced herbal tea in the fridge - tastes great, cheap and has no sugar or sugar substitutes. Buying cappuccino at chains like Starbucks or Costa everyday, while convenient, can easily total £1,000 a year, based on our calculations. Instant coffee with a dash of cinnamon or chocolate on top is an easy and impressive alternative.
Food and drink may be necessary for life, but a few small tweaks can help you spend less on them.
In addition to the steps above, if you're struggling with the budget it can be handy to have a deep dive into your current household spending. People are often surprised when they run the numbers over a month and realise how much they spend on expensive food items like takeaways or coffee-shop coffee. For example, spending £40 on a weekly pizza takeaway, including soda and appetizers, adds up to over £2,000 a year! Popping a few frozen grocery store pizzas in the oven will cost less than half the price.
To understand your food spending you can sit down with pen and paper and go through your bank statements and credit card bills once a month. Alternatively, there are a number of handy tech resources at our disposal these days.
For example, Money Dashboard is a personal finance app where you can easily view all your accounts and track your spending by category - they have separate pre-set categories including 'groceries' and 'food & drink', which tracks money spent eating out. Money Dashboard is rated 4.9 out of 5 stars by existing customers and is free to use. Budgeting apps like this (there are a number of others in the market, including Emma and Plum) can be a great resource if you're watching your spending.
While food is clearly a large budget item, there are a few categories that take an even larger bite of the average annual household budget. The average UK household also spends over £4,750 on transportation costs (including related insurance) and a whopping £10,600 on all things housing. Our largest utility cost is gas and electricity. The average UK household spent another £1,800 or so per year on gas and electricity in 2025. The cost to light, heat and run our homes accounts for close to 5% of our household budgets each year.
If your household buys in bulk to save money and keeps a large store of food in the freezer, especially expensive items like meat, you might want to check your home insurance policy to see if freezer contents are covered. Policies that include freezer food will reimburse you up to a certain amount (e.g., £1,000) if, for instance, you lose the contents of your freezer due to an electrical failure or your freezer breaking down.
Note: Updated in July 2026 to reflect the most recent Living Costs and Food Survey from the ONS and recent inflation statistics through May 2026. The data here are estimates as to typical food spending; please use these figures for informational purposes only.
Author
16 July 2026
21 min read
Contents
Average Food CostsFAQsHow Does Food & Drink Spending Vary across Income Groups?ShortcomingsCheap Eats: How to Save on FoodComparing Food Spend to Other Areas of the BudgetThe guidance on this site is based on our own analysis and is meant to help you identify options and narrow down your choices. We do not advise or tell you which product to buy; undertake your own due diligence before entering into any agreement.
Author
Erin was the founder of NimbleFins, a data driven personal finance site. A former derivatives trader and finance expert at the Stanford Graduate School. Erin turns research into plain answers so you can understand your credit.